Four runs with identical set-ups were done to check if increasing the total number of events plotted would allow photoelectron peaks to be visible in the pulse area and maximum histograms. SiPM 4 and the green LED (with a 3.23kOhm resistor) were placed in the dark-box. Each run contains 10,000 events.
| Table 1: Data files used in the long run test. |
| Run | Date | Data file |
| 1 | 2013/06/21 | 130621_greenLED_threshold9000_10Hz_100ns_3.23kOhm.dat |
| 2 | 2013/06/24 | 130624_greenLED_threshold9000_10Hz_100ns_3.23kOhm.dat |
| 3 | 2013/06/24 | 130624_greenLED_threshold9000_10Hz_100ns_3.23kOhm-3.dat |
| 4 | 2013/06/24 | 130624_greenLED_threshold9000_10Hz_100ns_3.23kOhm-2.dat |
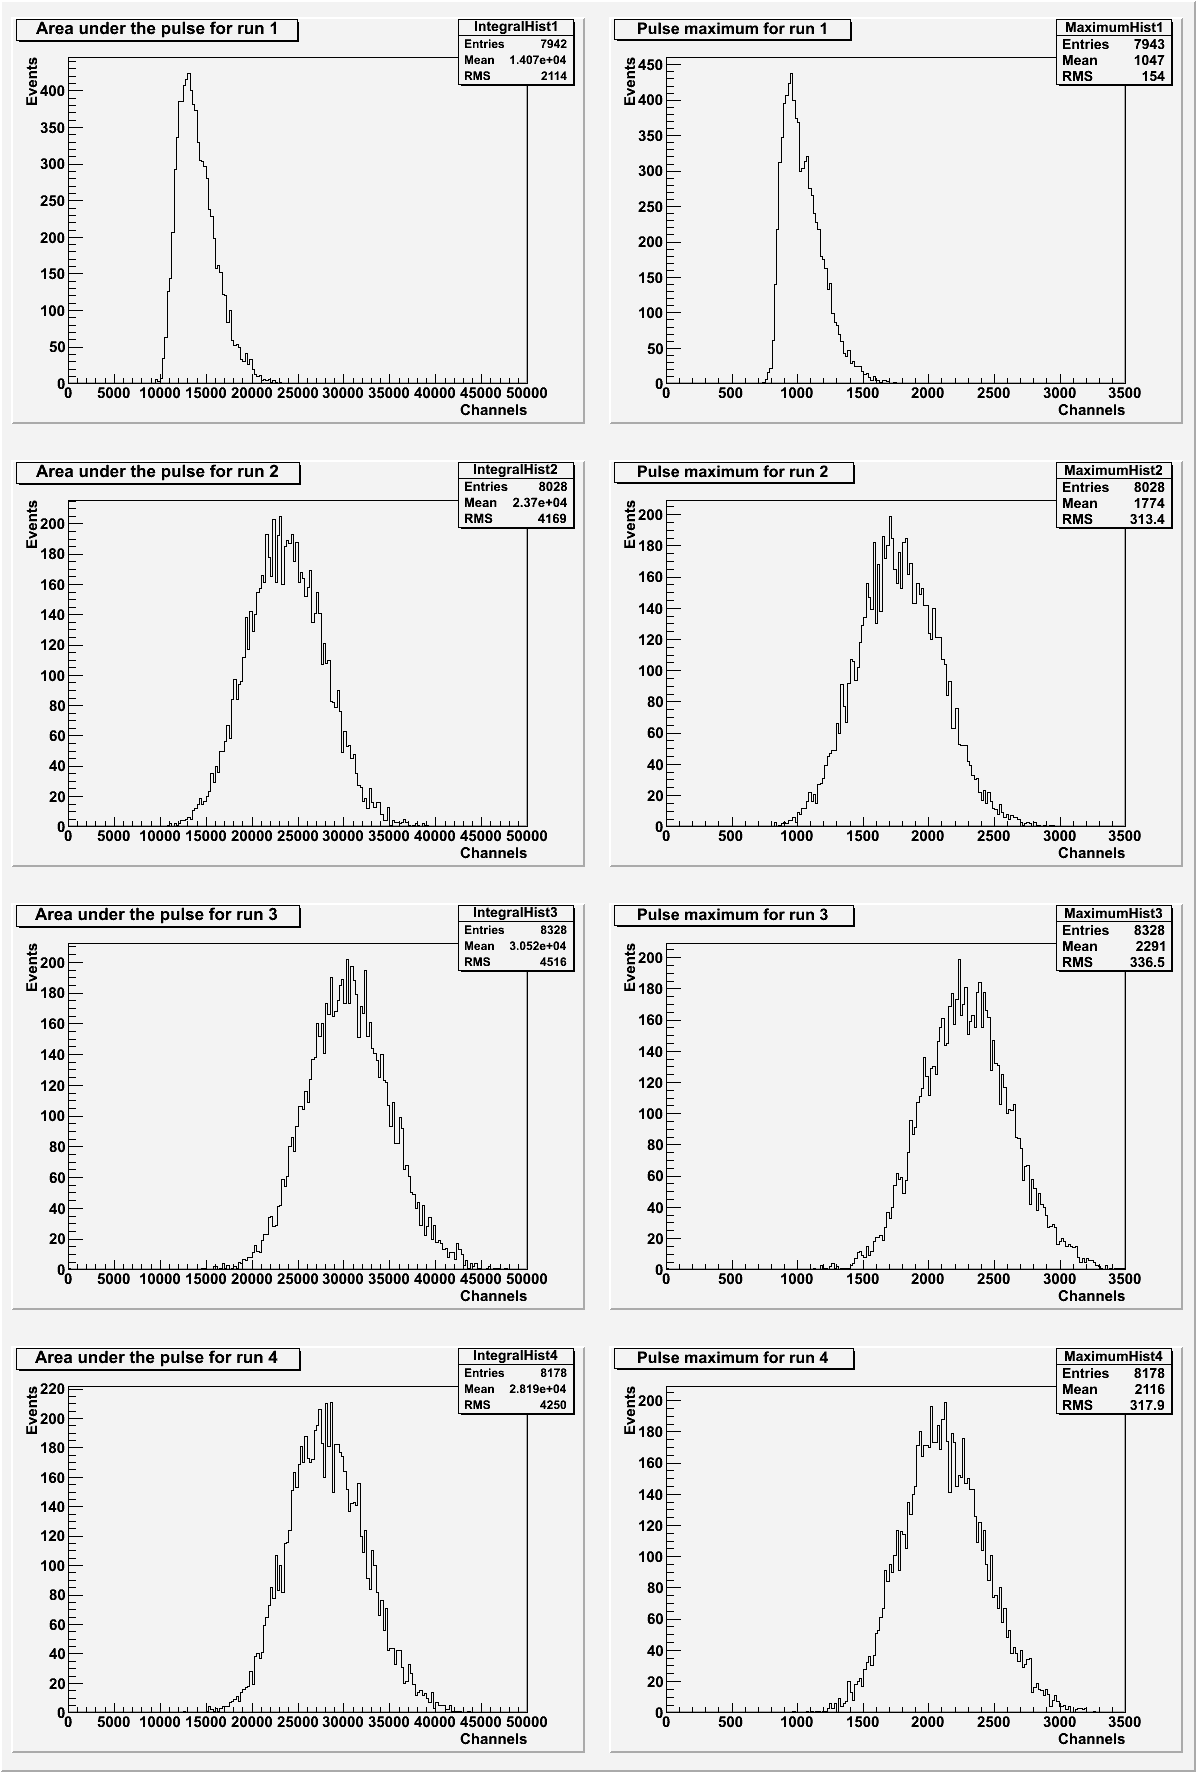
| Figure 1: Pulse area and pulse maximum for each individual run. |
 |
| Figure 2: Pulse area and pulse maximum for the combined runs. |
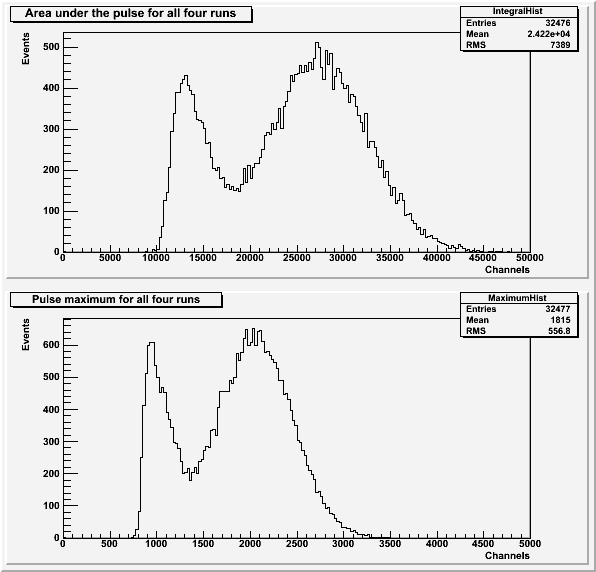 |
The double peak visible in the combined run histograms is due to the shifted peak in the run from 2013/06/21. There are still no photoelectron peaks visible in any of the histograms. In order to see peaks, a larger resistor should be used.