−Table of Contents
Background Run with the new shielding configuration: "Neutron Bottle"
Shielding Set up
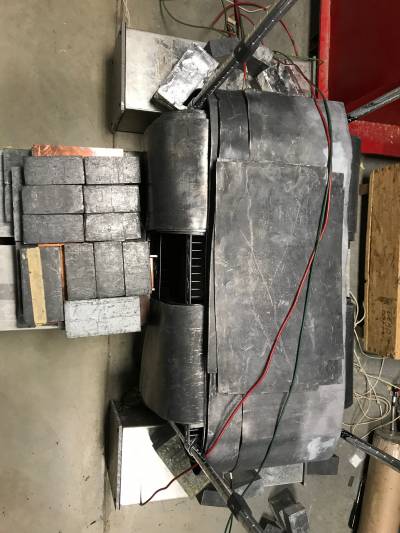
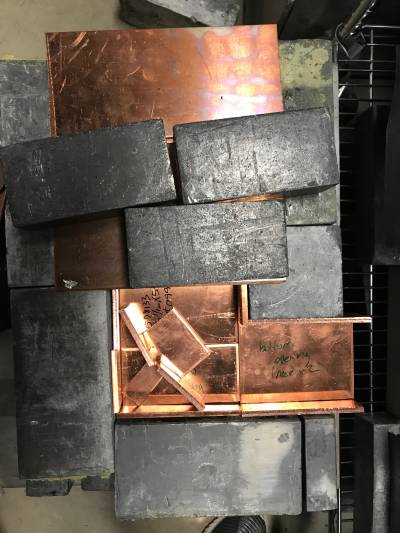
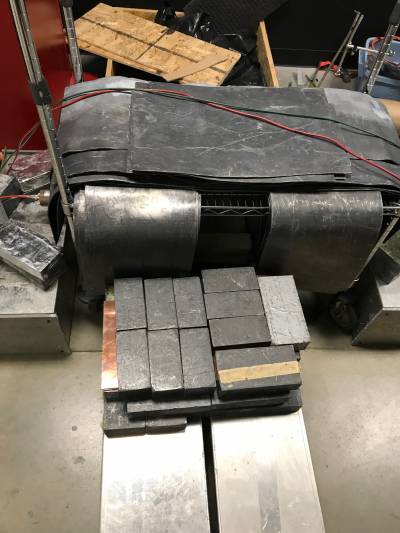
On one side of the PMTs, the shield is made up of a base of 2“ Pb bricks, above which is a reflective path made out of copper sheets to bounce the neutrons, followed by another layer of 2” Pb bricks at the top. The other side of the shield consists of a couple of 2“ Pb bricks in the space between the two detectors. Pb sheets are used to curve over each of the detectors. The crate holding the PMTs has a shelf which is locked above the detectors. Pb sheets are also placed on this platform to shield the top. The sheets also curve around the sides of the PMTs. Pb bricks are also used in the shield on the front and back sides of the detectors, placed around the PMT.
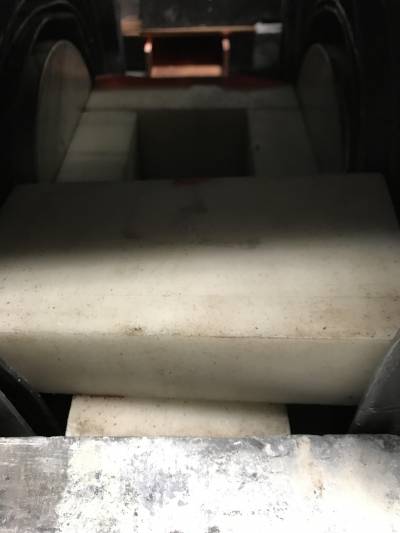
A poly castle is made using 2” poly bricks in between the two detectors. The poly bricks are centered around a point at the center of the faces of the two detectors, where the Gd vial will be placed.
| Figure 1: Top view of shielding | Figure 2: Reflective path for neutrons built from copper sheets |
|---|---|
 |  |
| Figure 3: Front View of shielding | Figure 4: Poly Castle in between detectors |
 |  |
Cf-252 Runs: "AND" trigger
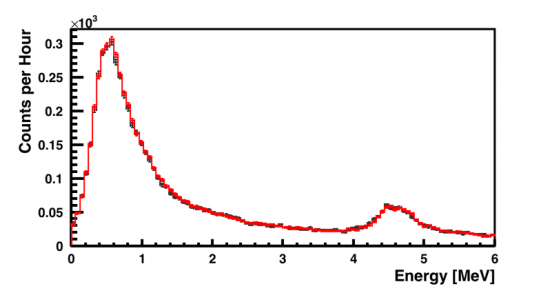
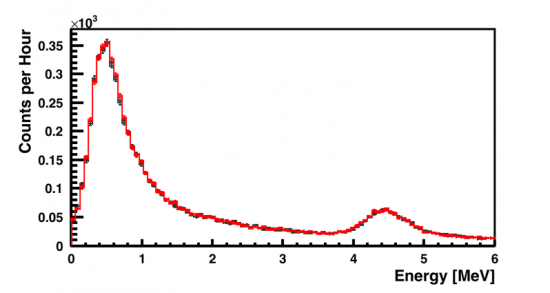
An AND coincidence between Detectors B and C was used to trigger the DAQ. The threshold for each detector was set to 0.39MeV. These runs were NOT deadtime limited.
| Figure 5: Detector B (black = Cf-252, red = Cf-252 + Gd) | Figure 6: Detector C (black = Cf-252, red = Cf-252 + Gd) |
|---|---|
 |  |
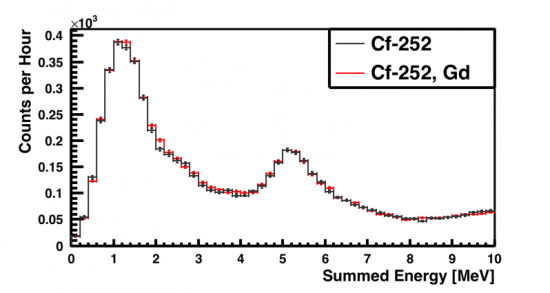
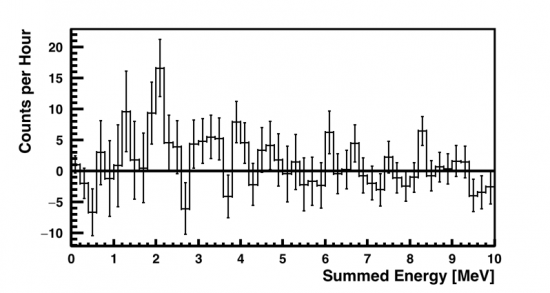
| Figure 7: Sum of Detectors B and C | Figure 8: Plots in Figure 7 subtracted: (Cf-252 + Gd) -(Cf-252) |
|---|---|
 |  |
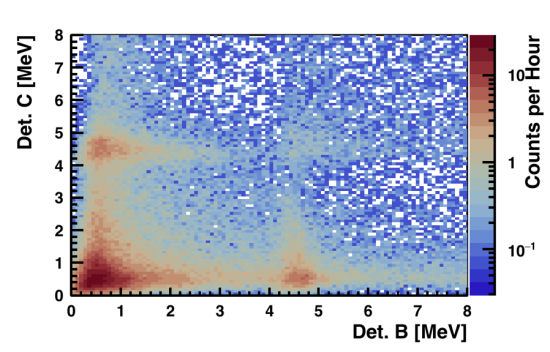
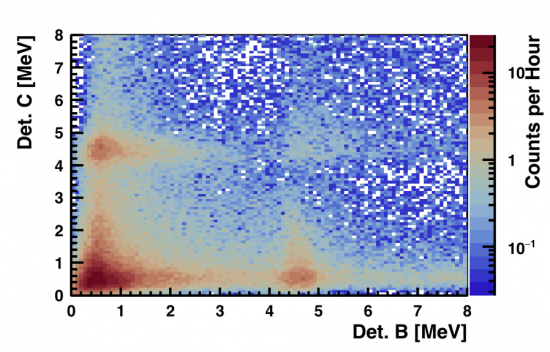
| Figure 9: Coincidence Plot: Cf-252 | Figure 10: Coincidence Plot: Cf-252 + Gd |
|---|---|
 |  |
| Figure 11: Coincidence Plot subtracted: (Cf-252 + Gd) -(Cf-252) |
|---|
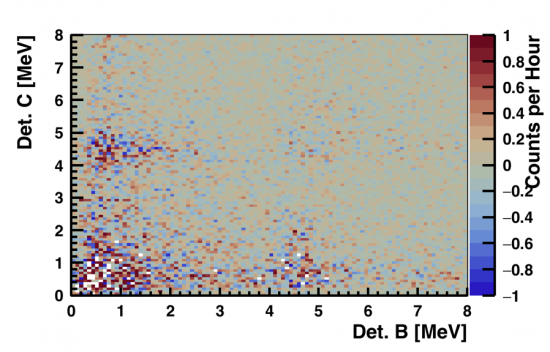 |
An increase in trigger rate was observed, specifically (0.0211 +/- 0.0083) Hz. While this is not within error of 0, it is quite small. A local peak around 2 MeV can be seen in Figure 8 where the gammas from neutron capture on hydrogen are expected. However, it is not very pronounced and may not be significant enough to make any claims.
Cf-252 Runs: "OR" trigger
An OR trigger condition between Detectors B and C was used to trigger the DAQ. The threshold for each detector was set to 0.39MeV. These runs were NOT deadtime limited.
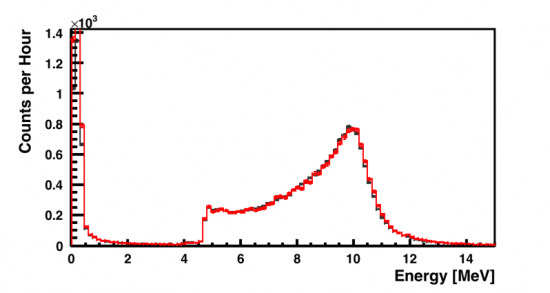
| Figure 12: Detector B (black = Cf-252, red = Cf-252 + Gd) | Figure 13: Detector C (black = Cf-252, red = Cf-252 + Gd) |
|---|---|
 | [image not archived: 20180409_cf252_or_bottle_detc.png] |
| Figure 14: Sum of Detectors B and C | Figure 15: Plots in Figure 7 subtracted: (Cf-252 + Gd) -(Cf-252) |
|---|---|
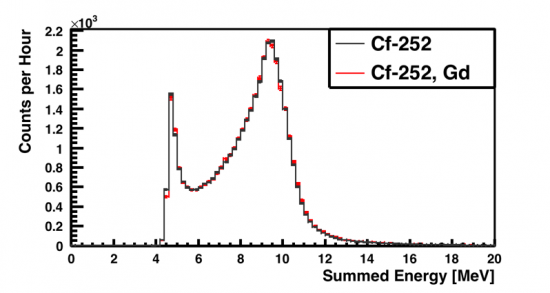 | 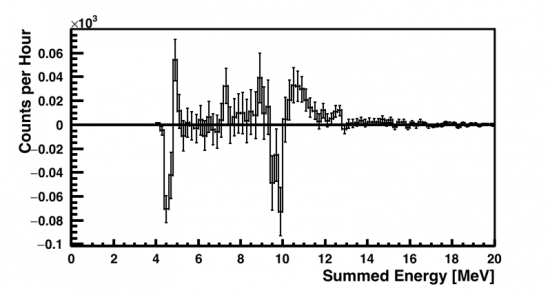 |
| Figure 16: Coincidence Plot: Cf-252 | Figure 17: Coincidence Plot: Cf-252 + Gd |
|---|---|
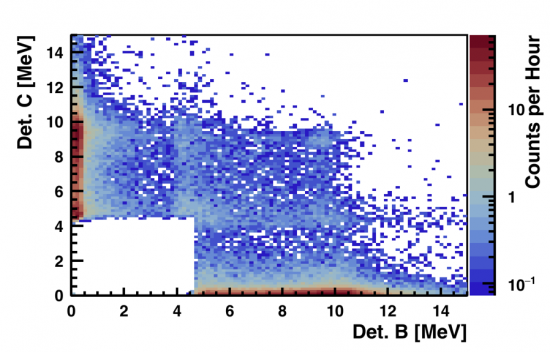 | 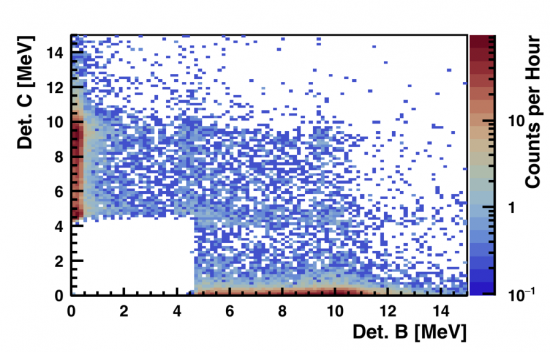 |
| Figure 18: Coincidence Plot subtracted: (Cf-252 + Gd) -(Cf-252) |
|---|
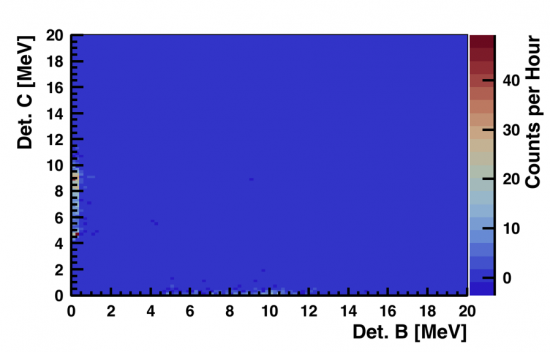 |
No increase in trigger rate was observed.
Na-22 511KeV Peak calibration
A Na-22 source was placed in between the two detectors with the above shielding configuration (without the poly castle in between the two detectors) and a calibration factor for the detectors was determined with the new power source using the 511 peak.
For Detector B, 32.1 +/- 3.0 mV corresponded to a 0.511 MeV energy, while for Detector C, 39.0 +/- 3.0 mV corresponded to a 0.511 MeV energy.
Conversion Factors (approximate): Det B 1 mV = 0.0159 MeV Det C 1 mV = 0.0131 MeV
Dead Time Limitations
Since we are trigger on an 'OR' in this setup, the trigger rate was 32.21 Hz for a threshold of around 1.6 +/- 0.4 MeV on the discriminator unit. Our DAQ unit can only take around 16 data points per second, which poses a dead time limitation, since we do not want to push the threshold beyond 2 MeV.
A trigger rate of roughly 16 Hz (the value at which we stop becoming deadtime limited) was achieved with an OR trigger and thresholds of 3.6 MeV for each detector.