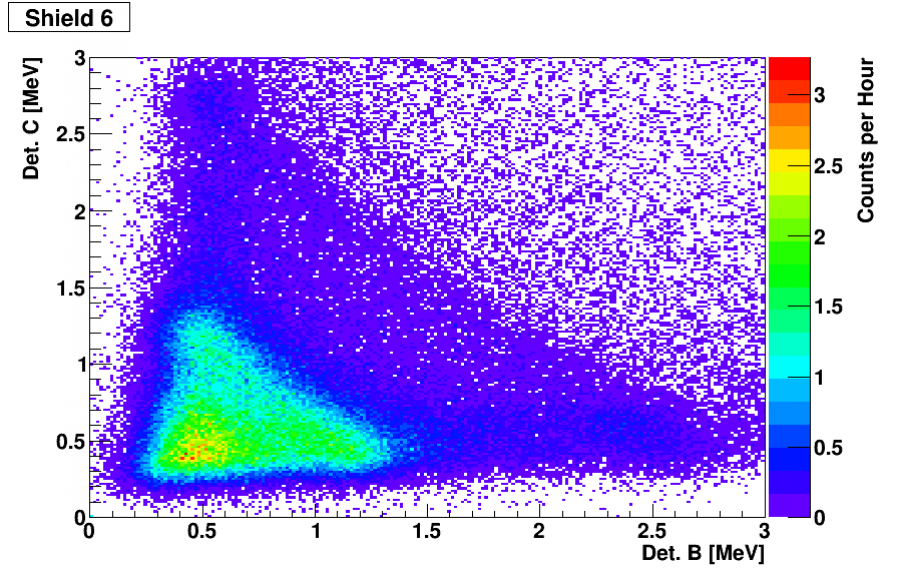
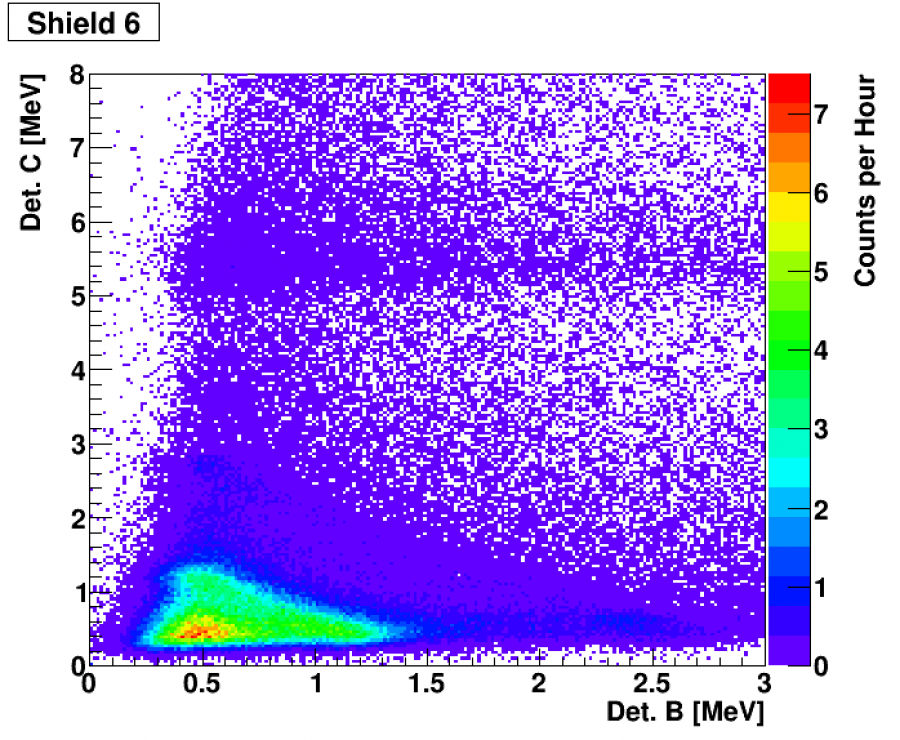
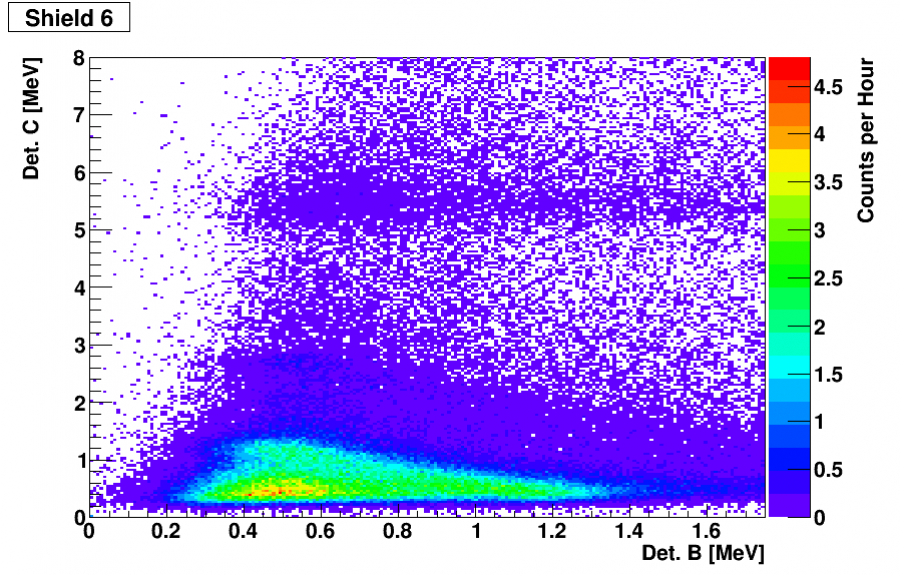
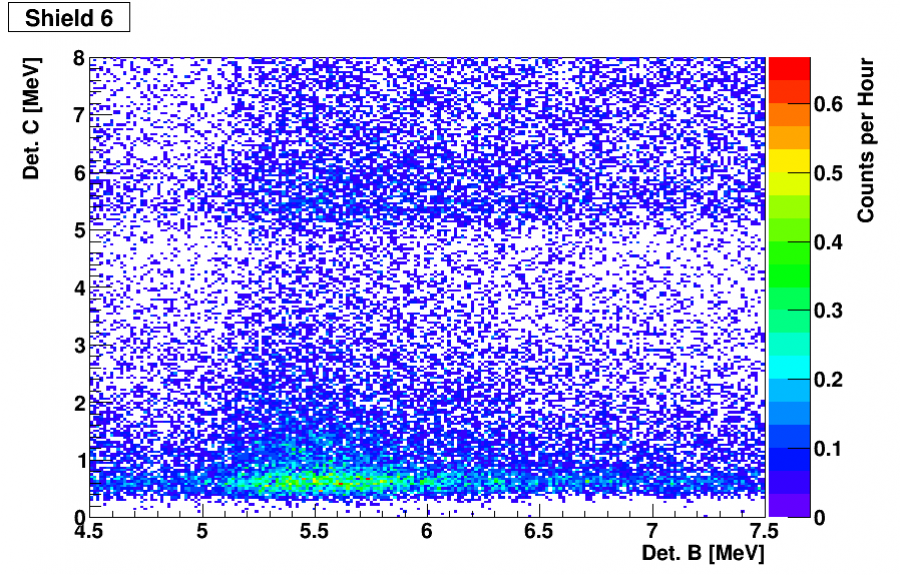
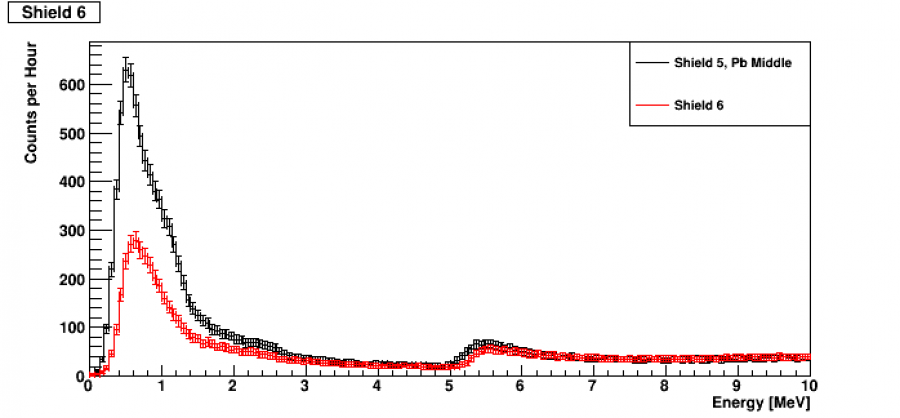
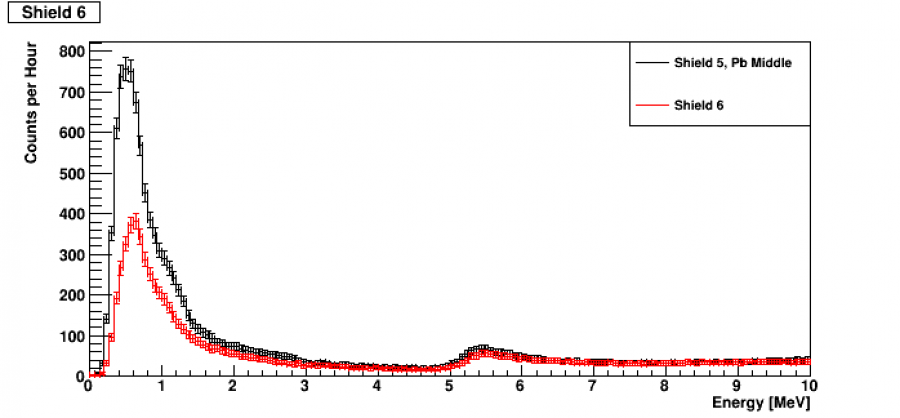
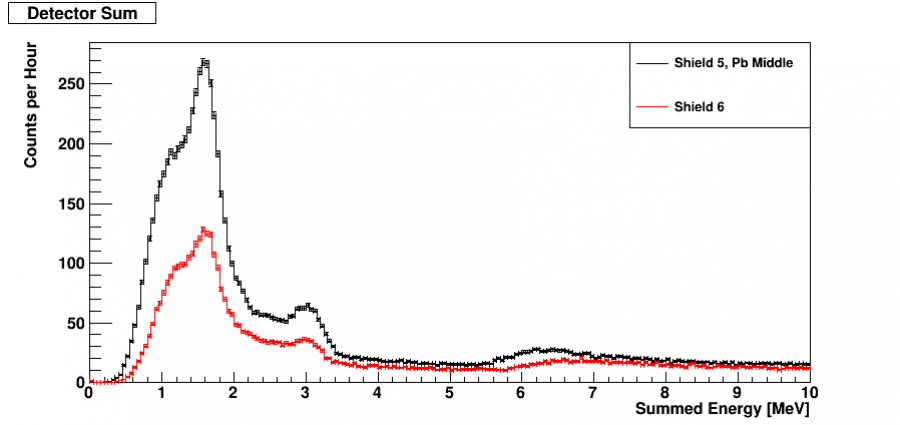
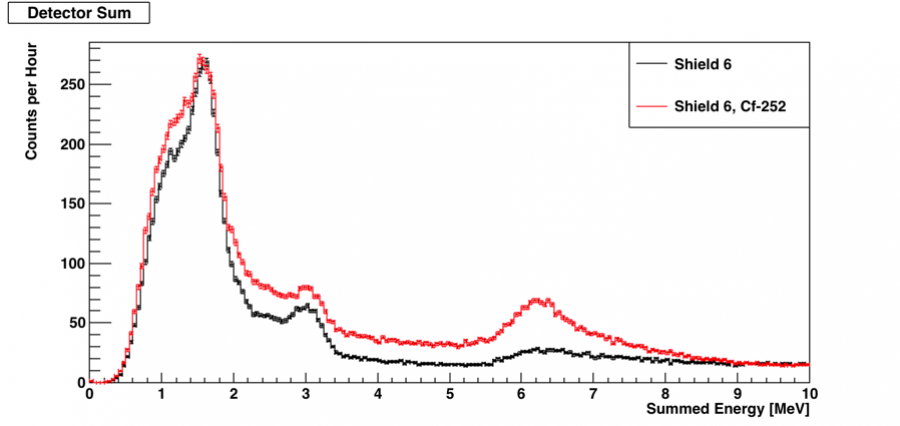
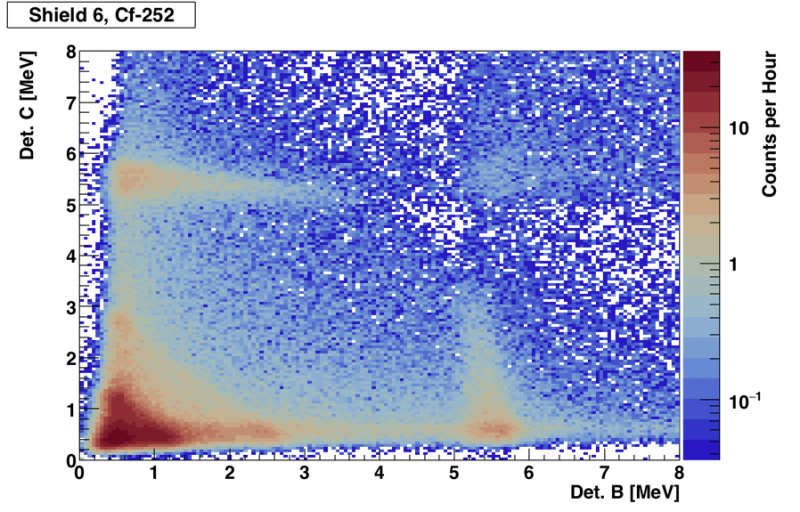
Follow up graphs from previous meeting. Shows Coincidence plots for different ranges on Det B and Det C.
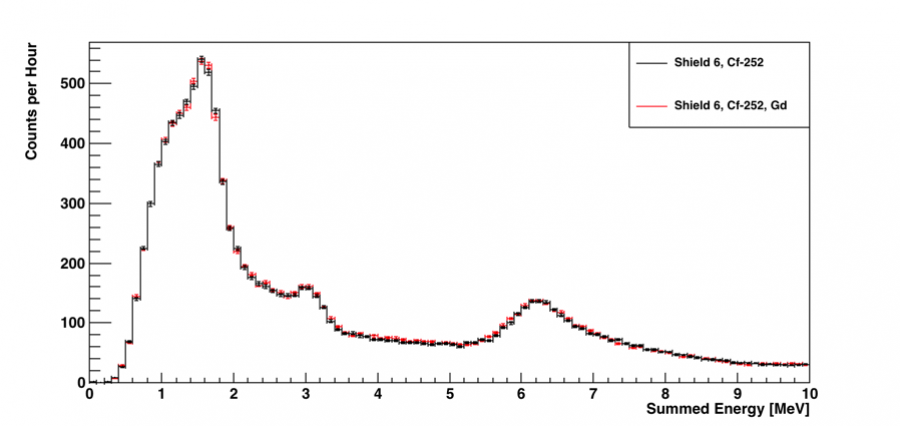
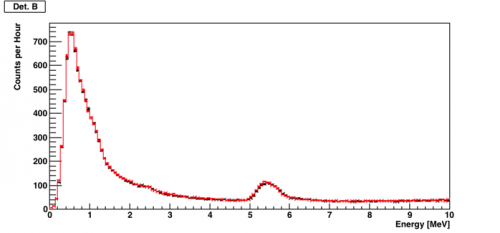
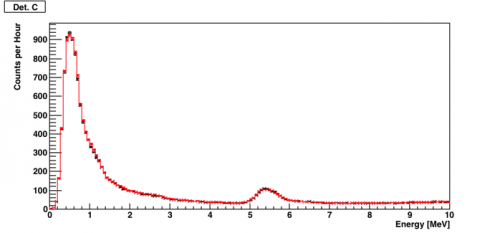
Count/hour vs Energy graphs are shown with x axes extended upto 10 MeV
No differences or peaks are really visible by eye. However, a trigger rate difference of 0.05 +/- 0.01 counts per second was observed for [0.5,10] PE for the summed detectors. This is the first time a positive rate difference, as well as one that is not within error of 0, has been observed.
| Figure 3: Detector Sum Plots |
 |
| Figure 4: Detector B | Figure 5: Detector C |
 |  |
| Figure 6: Detector Sum, Subtracted Plot, (Source+Gd) - (Source) |
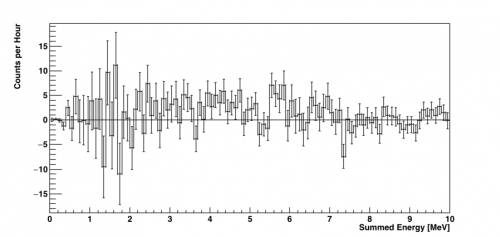 |
| Figure 7: Coincidence Subtracted Plot, (Source+Gd) - (Source), fine binning | Figure 8: Coincidence Subtracted Plot, (Source+Gd) - (Source), coarse binning |
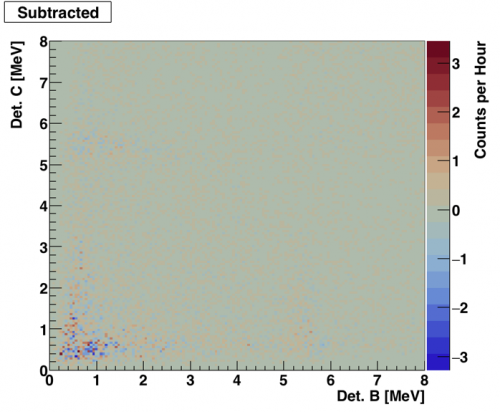 | 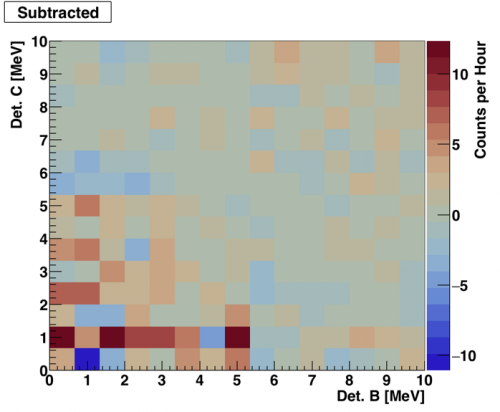 |