−Table of Contents
NaI Detector Shielding
Background, shield 1
Experimental Procedure
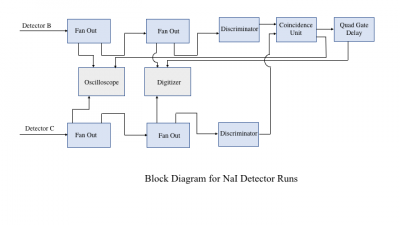
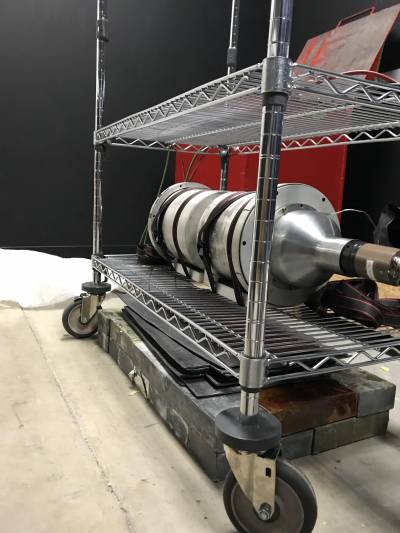
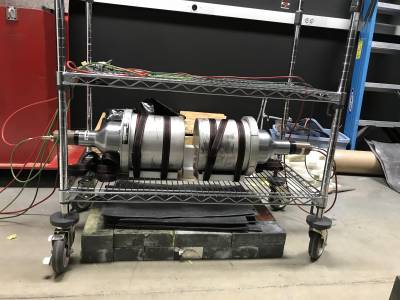
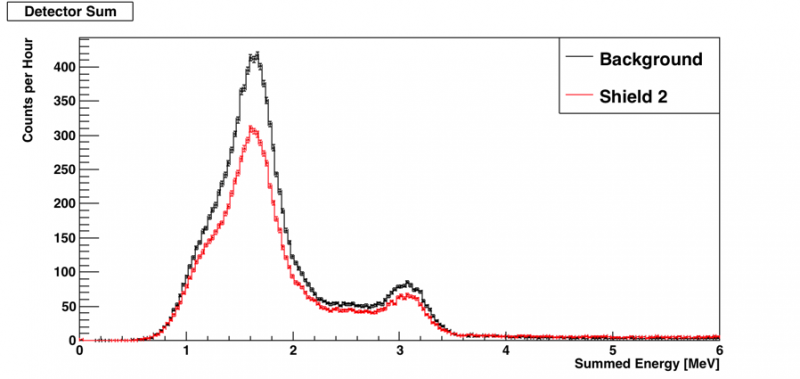
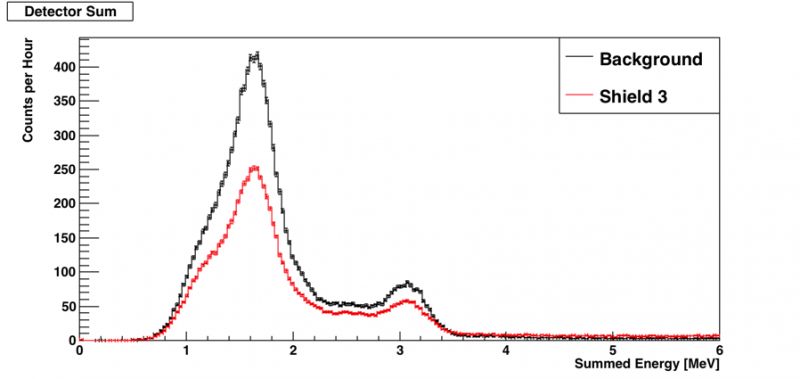
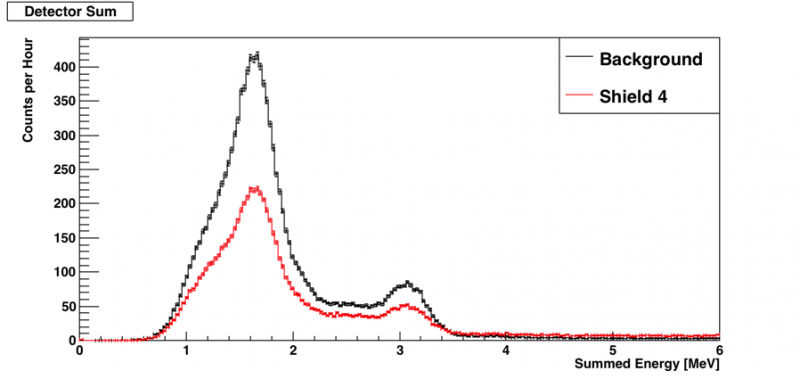
The NaI detectors were placed back to back on a trolley and fixed in place with straps. A positive HV source was used to bias the detectors at 1100V and data was read out from the anode. The threshold on the discriminator was set to 30mV and a digitizer was used to read in analog data from the detectors. A coincidence unit was used for Detectors B and C as a trigger. Two runs were performed for the setup- A background run was executed without any shielding, and then another run was conducted with a lead shielding on the floor ( 4 inches of Pb bricks plus 1.5 inches of Pb sheets under cart).
Notes:
- Use 0.5V scale with -0.25 offset. Signals become saturated at about 0.8V, which corresponds to about 13 MeV.
| Figure 1: Block Diagram of Setup |
|---|
 |
| Figure 2: Shield 1 | Figure 3: Shield 1 |
|---|---|
 |  |
| Table 1: Summary of Data | |||||
|---|---|---|---|---|---|
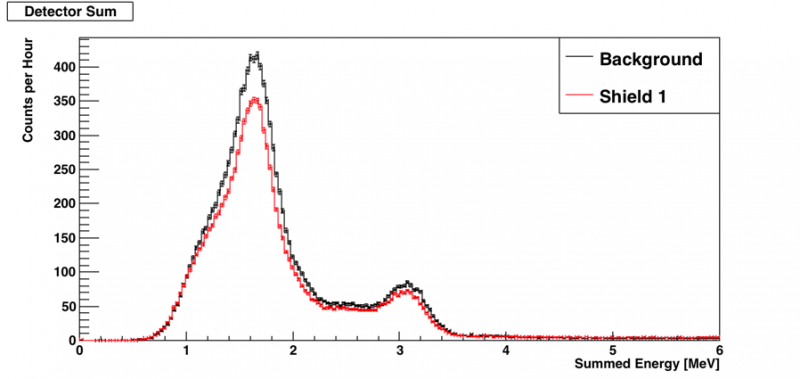
| Trigger rate (Hz) | 1.57 MeV Peak height (counts/hour) | % Reduction | 2.94 MeV Peak height (counts/hour) | % Reduction | |
| Background | 4.67 +/- 0.01 | 427.5 | 86.1 | ||
| Shield 1 | 4.34 +/- 0.01 | 351.9 | 71.7 | ||
| Shield 2 (Shield 1 + 1 sheet arched over each detector) | 4.20 +/- 0.01 | 287.2 | 62.2 | ||
| Shield 3 (Shield 2 + sheets on top shelf and hanging over sides) | 3.96 +/- 0.01 | 249.8 | 57.8 | ||
| Shield 4 (Shield 3 + more hanging over sides + curved around NaI PMTs) | 3.78 +/- 0.01 | 221.4 | 50.4 | ||
| Shield 5 | 175 | ||||
| Figure 4: |
|---|
 |
| Figure 5: |
 |
| Figure 6: |
 |
| Figure 7: |
 |