−Table of Contents
Monochrometer measurements
Experimental Setup
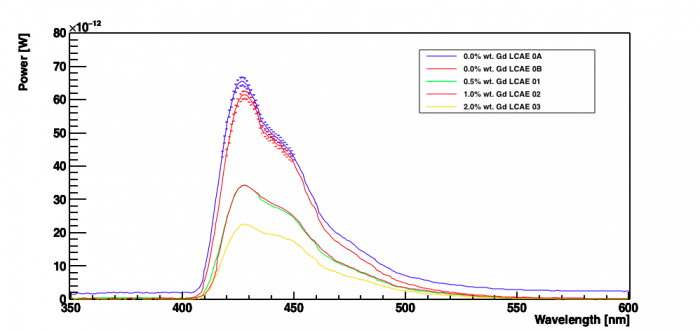
Each of the LCAE Samples were wrapped thrice with PTFE Tape and then clamped at a fixed distance from the face of the monochrometer, with the axis of the cylindrical samples perpendicular to the circular face of the monochrometer . A UV LED was used to illuminate the back face of the sample. The LED was positioned about a mm away from the back face of the sample. A photodiode was used to measure the power of the light output from the monochrometer and a graph of Power vs Wavelength was plotted.
This procedure was repeated for LCAE samples 0A and 0B(0.0% Gd), LCAE-01(0.5% Gd), LCAE -02(1.0% Gd) and LCAE -03(2.0% Gd)
Instrumental settings
The UV LED was given a bias of 8.45V from the 8110A Unit. The distance between the LED and the face of the sample was set to about a millimeter. The monochrometer was made to cycle over wavelength range of 350nm-600nm.
Power vs Wavelength Graph
| Figure 1: |
|---|
 |
Peak Height Ratios
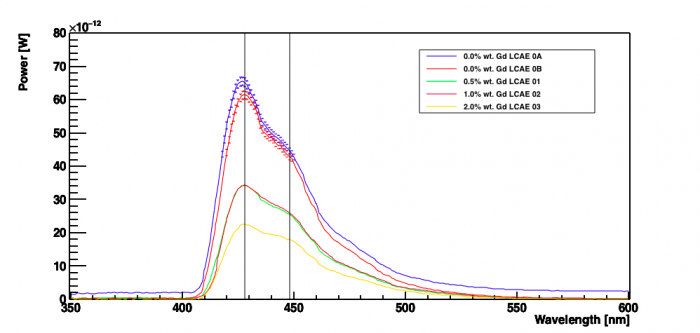
| Figure 2:First Peak at 428nm, Second Peak at 448nm | |
|---|---|
 |
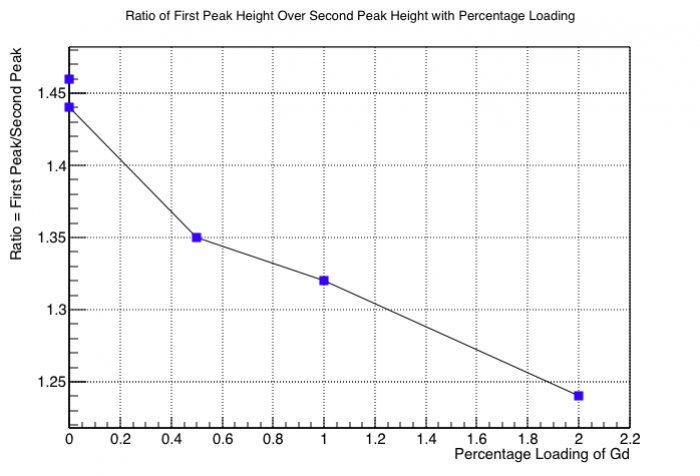
| Figure 3:Ratio of First Peak Height to Second Peak Height vs Percentage Loading of Gd |
|---|
|  |