NaI Run Analysis
Analysis Method
The start of the pulse integration region was chosen to left of the peak where the average of 4 bins of the signal was at least 3 times the standard deviation of the background. The same was done to the right of the pulse to determine the end of the integration region. While pulse shape fitting did improve the amplitude analysis method, it did not improve on the pulse area analysis method.
| Table 1: Shield geometries |
| 1 | Walls of 2“ Pb, no top |
| 2 | Walls of 2” Pb, top of 1“ Pb |
| 3 | Walls of 2” Pb, top of 6“ Pb |
| 4 | Walls of 2” Pb, top of 2“ Pb |
Na-22 Source Calibration
| Figure 1: Na-22 Calibration Plot |
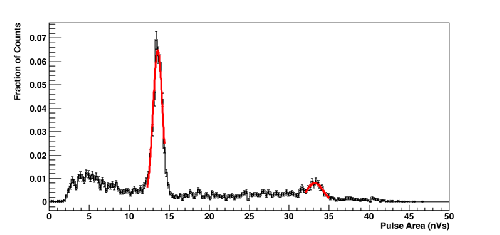 |
| μ1 ± σ1 = 13.56 ± 0.60 nVs |
| μ2 ± σ2 = 33.2 ± 1.0 nVs |
The resulting conversion factor, 0.0382664 MeV/nVs was used to convert pulse areas to deposited energies.
Cf-252 Source Runs
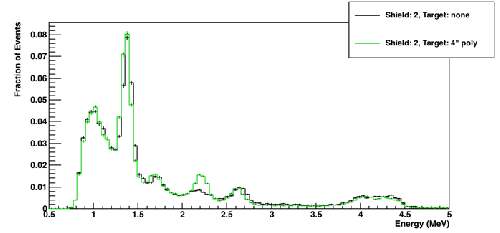
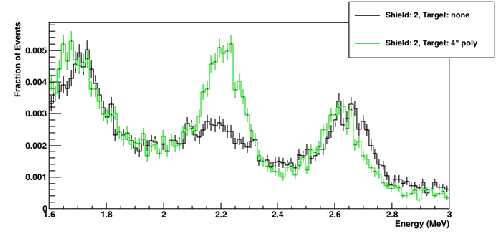
| Figures 2 and 3: 50mV threshold, poly target |
 |  |
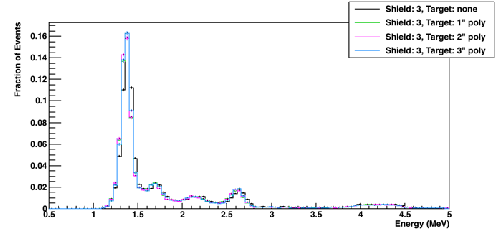
| Figures 4 and 5: 75mV threshold, poly target |
 | 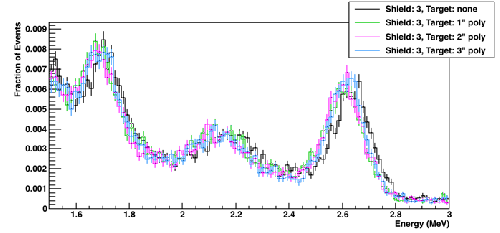 |
| Figures 6 and 7: 300mV threshold, Gd target |
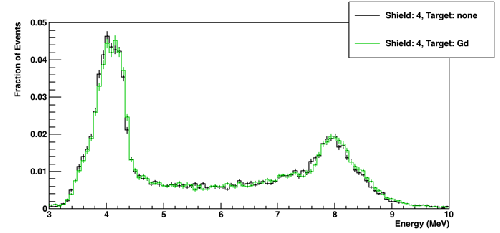 | 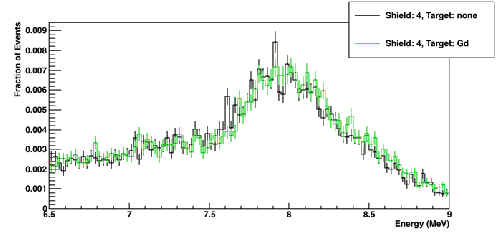 |
Conclusions
The detector needs more shielding around it, rather than just around the source. Moving forwards, it might be best to finish what we can of the paper while we wait until we can next use the detectors.