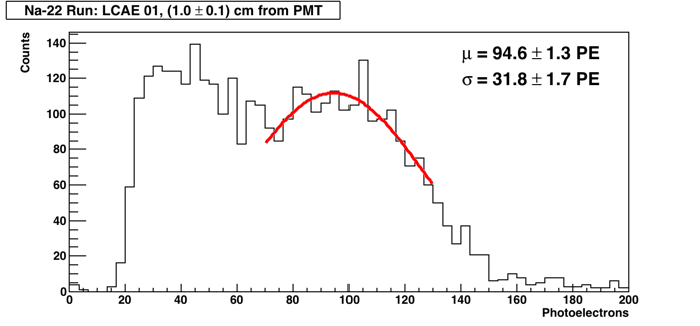
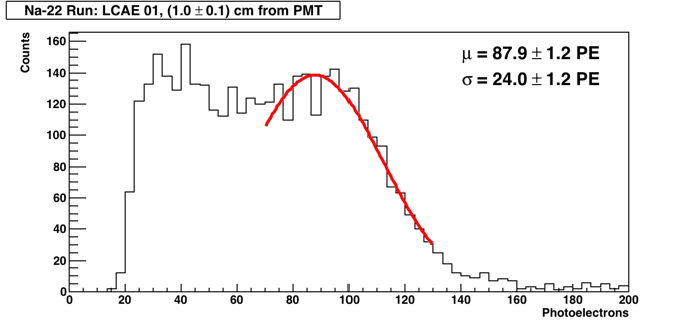
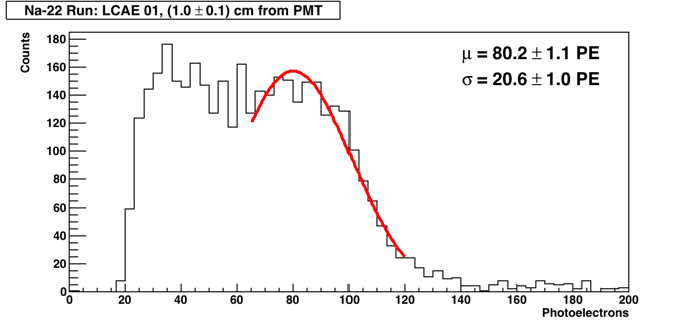
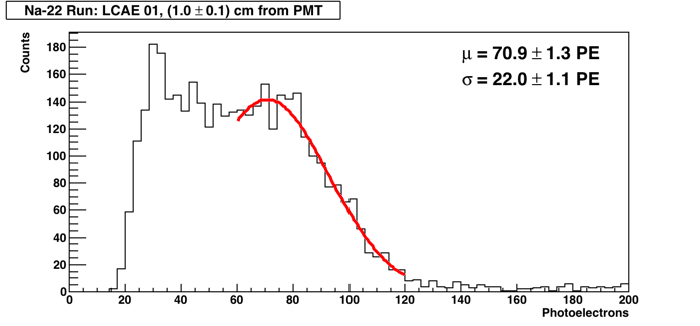
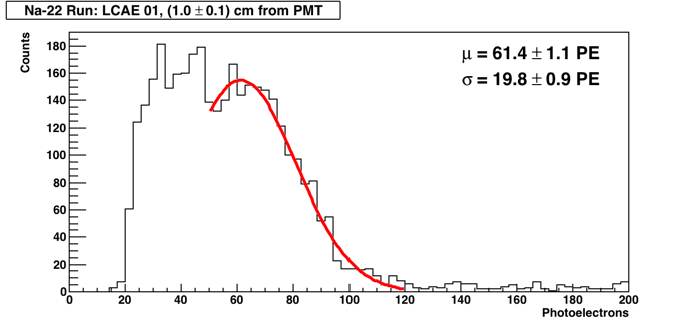
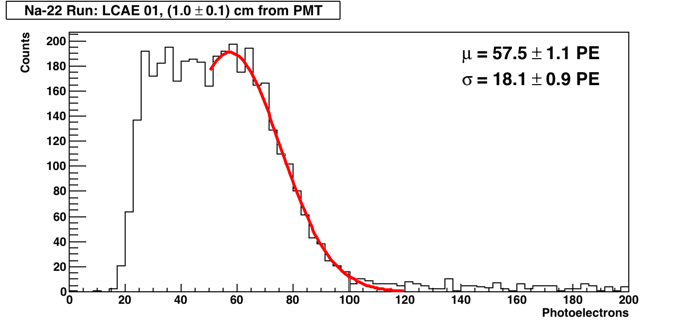
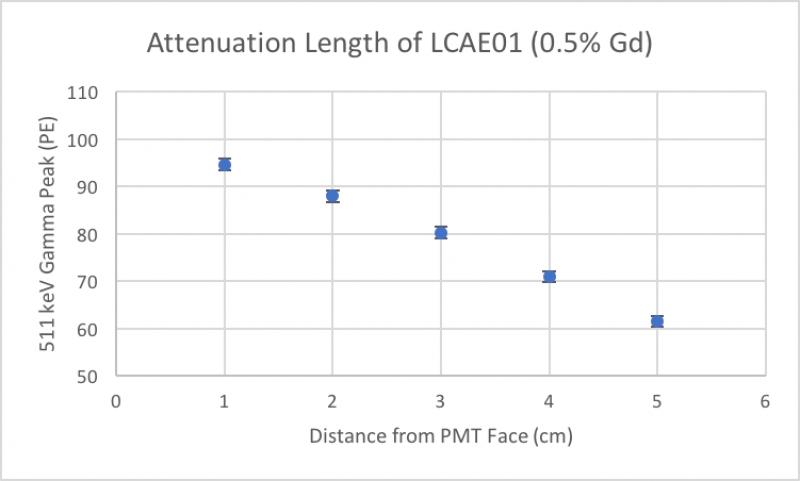
Attenuation of photon energy inside the sample scintillator when neutrons are incident on different points along the length of the sample was studied. A Na-22 source was used to generate neutrons. Two halves of a lead cube with fine holes on two opposite faces was used as a collimator. A PMT with a generic scintillator was positioned with its length perpendicular to the incident radiation from one face of the collimator and another PMT with the sample scintillator was positioned with its length perpendicular to the radiation from the opposite face of the collimator. The sample scintillator was wrapped with PTFE tape and a cap of black plastic was put on one face of the sample. Optical grease was applied on the other face and attached to the PMT.
7 Data points were collected, 1cm apart, starting from the end of the sample attached to the PMT.
A bias of 1700V was applied to the PMT with the sample scintillator and a bias of 1000V was applied to the PMT with the generic scintillator.
Outputs from the PMTs were connected to a Lecroy Oscilloscope and also to a Discriminator. The threshold for the The discriminator had a threshold of -30mV for the two signals and a coincidence unit was used to record a coincidence between the two signals from the PMTs in a time interval of 20ns. This output from the coincidence unit was also connected to the oscilloscope. A LabView program collected data for 3000<triggers<4000.