−Table of Contents
PMT Gain Measurement
Procedure
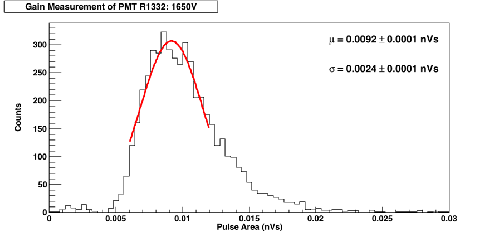
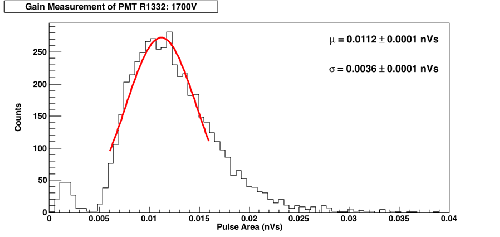
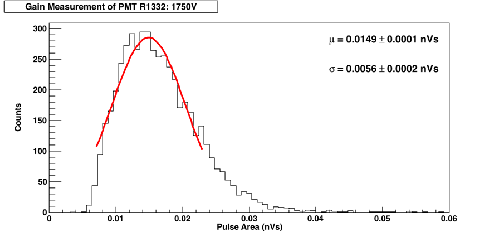
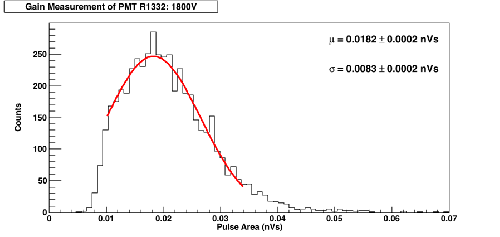
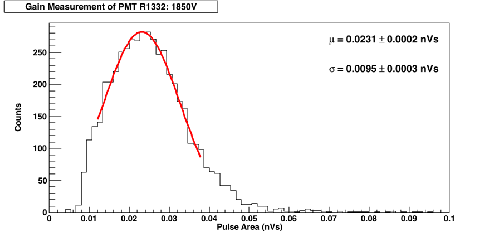
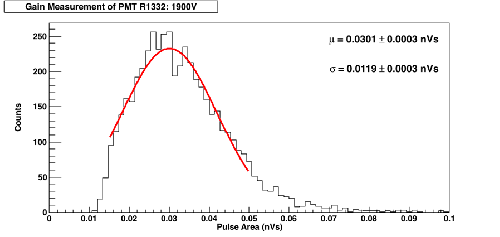
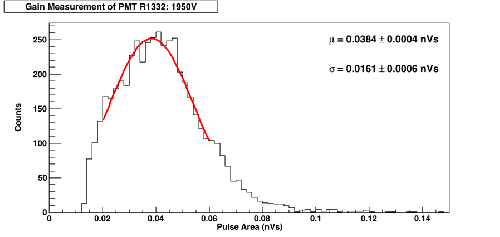
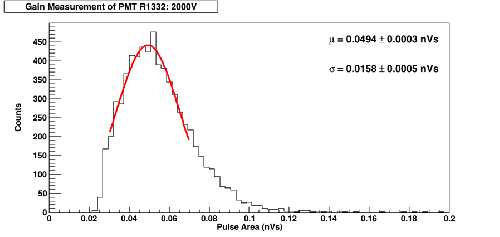
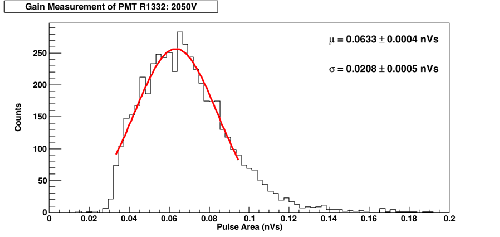
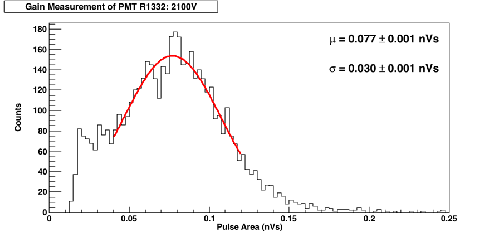
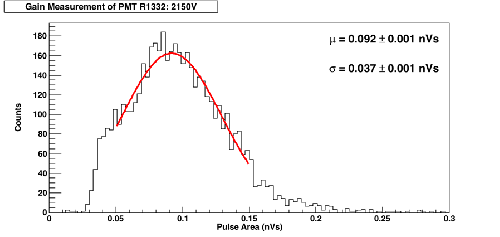
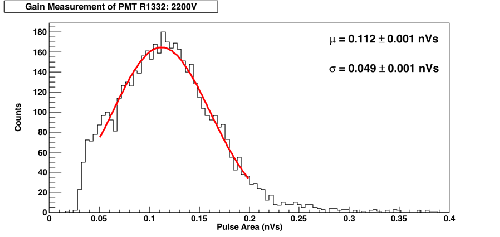
A Lecroy Wavesurfer Oscilloscope was used to self-trigger on signal pulses from a PMT. Various biases were applied. I began at the highest bias, 2200V, and lowered the trigger threshold until lowering it had no further effect on the mean of pulse amplitude histogram generated. For 2200V, a scale of 10mV/division and a threshold of 5 mV was used. 5000 data points were collected for each bias. Pulse area was used in analysis.
From pulse area, gain was calculated using (1): (source: http://www.hep.umn.edu/cdms/cdms_restricted/chagani/thesis.pdf)

In this case, the load resistance is 50Ω.
Data
| Figure 1: | Figure 2: |
|---|---|
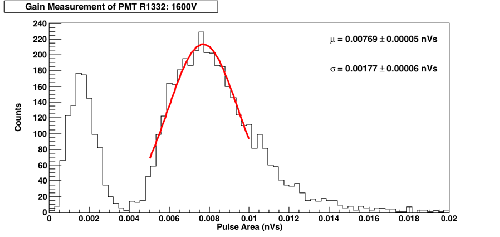 |  |
| An extra peak is seen at 0.0015 nVs. As this was the lowest voltage measured, noise pulses were observed when self-triggering. These noise pulses fluctuate wildly but tended to have a net positive area. Below this bias voltage, these noise pulses overwhelmed dark count pulses. | |
| Figure 3: | Figure 4: |
 |  |
| Figure 5: | Figure 6: |
 |  |
| Figure 7: | Figure 8: |
 |  |
| Figure 9: | Figure 10: |
 |  |
| Figure 11: | Figure 12: |
 |  |
| Figure 13: | |
 |
Analysis
| Figure 14: Gain Plot |
|---|
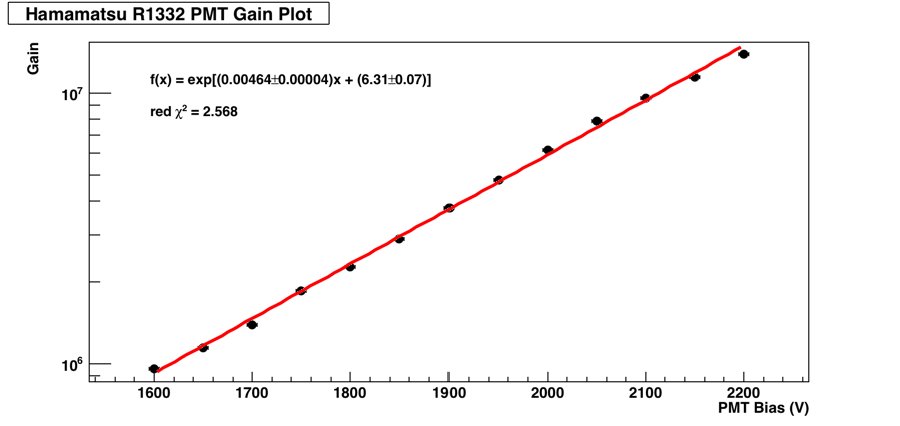 |
| The value of the slope has units of V-1. The intercept is unitless. Vertical error bars are too small to be seen, but were determined using the GetParError() function in Root. |
Analysis Programs
waveform_reduction_sipmGain.cxx
sipmGain_plot.C