−Table of Contents
Monochromator Measurements
Data collected on 2017/07/07.
Objective
The distance of the LED from the face of the monochromator was varied to examine the effects of undissolved dopant on light output as well as possible quenching from dissolved dopant.
Procedure
A similar procedure as described here was used. The UV LED was used to illuminate scintillator samples from the side. The LED illuminated unwrapped scintillator samples from above, as shown in Figures 1a and 1b.
| Figures 1a and 1b: Experimental Setup | |
|---|---|
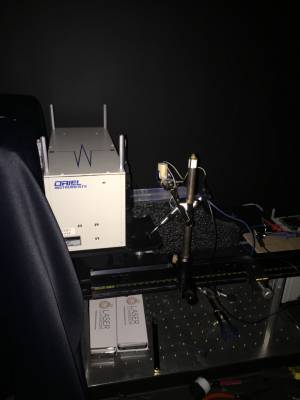 | 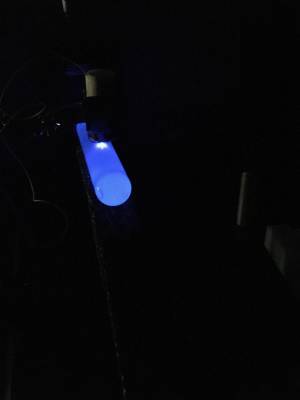 |
Unlike in previous trials, chemistry clamps were not used to hold the sample in place so as to prevent any unusual reflections. Furthermore, no reflective coverings (PTFE, aluminum foil) were used to cover the samples, as this was infeasible for the desired measurement. The LED was moved down the length of the scintillator sample in 1.5 cm intervals. The monochromator was power-cycled between each individual run.
Data
| Table 1: Summary of Sample Properties | ||||
|---|---|---|---|---|
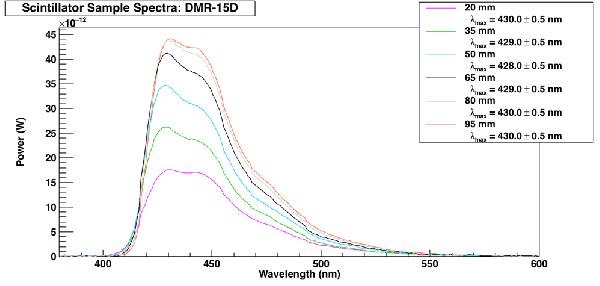
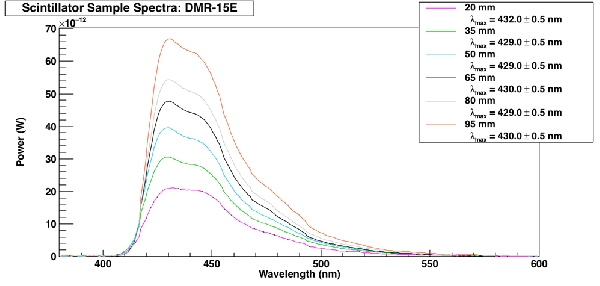
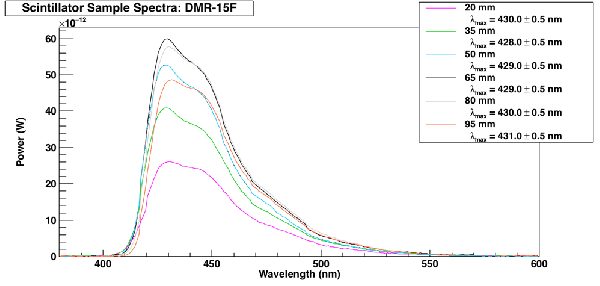
| Sample (DMR-15) | % wt. Gd | Mass of Compound Added | Filtered? | Both ends cut/polished? |
| A | 0% | 0 g | no | yes |
| C | 0.055% | 0.071 g Gd(i-Pr)3 | yes | yes |
| D | 0.055% | 0.151 g Gd(TMHD)3 | yes | yes |
| E | 0.1% | 0.103 g Gd(i-Pr)3 | no | no |
| F | 0.1% | 0.216 g Gd(TMHD)3 | no | no |
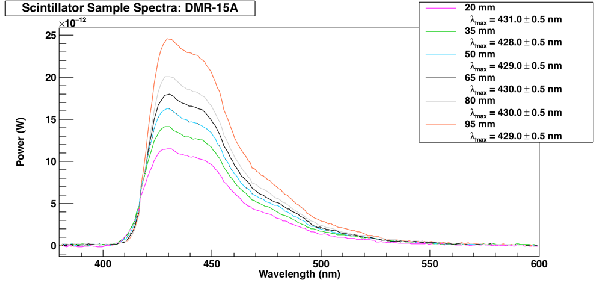
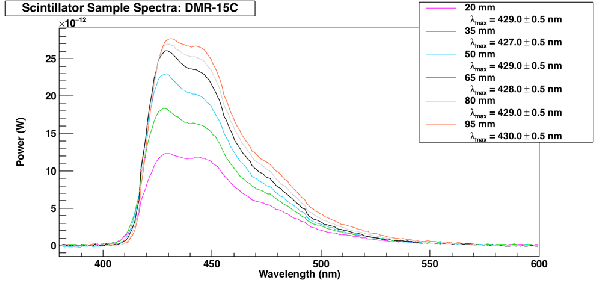
| Figures 2-6: Spectra of various samples as a function of LED distance |
|---|
 |
 |
 |
 |
 |
Analysis
| Figures 7: Relative Power at 431nm | Figure 8: Relative Power at 445nm |
|---|---|
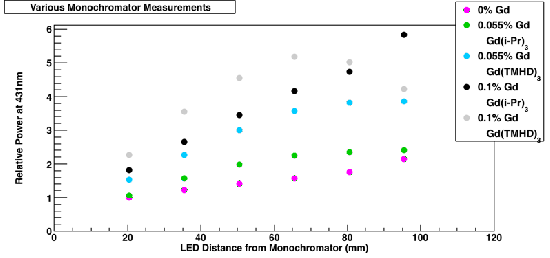 | 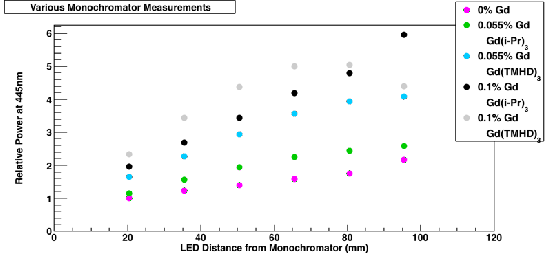 |
| The power at 431nm for each sample was divided by the power at 431nm of DMR-15A at 20mm | The power at 445nm for each sample was divided by the power at 445nm of DMR-15A at 20mm |
A trend corresponding to the amount of undissolved particulates in a sample can be seen. Light output also increases as the LED moves further away from the monochromator face.
Data further than 80mm from the monochromator may portray the effects of the end of the sample, namely whether or not the sample was machined, if any bubbles are present, crazing, or other factors (these samples are about 11 cm long). In particular, more crazing was present on the end of DMR-15F than the other samples. A linear trend can be seen up to 65mm, but as there are only four data points, more may be taken later to confirm the linearity of this trend.