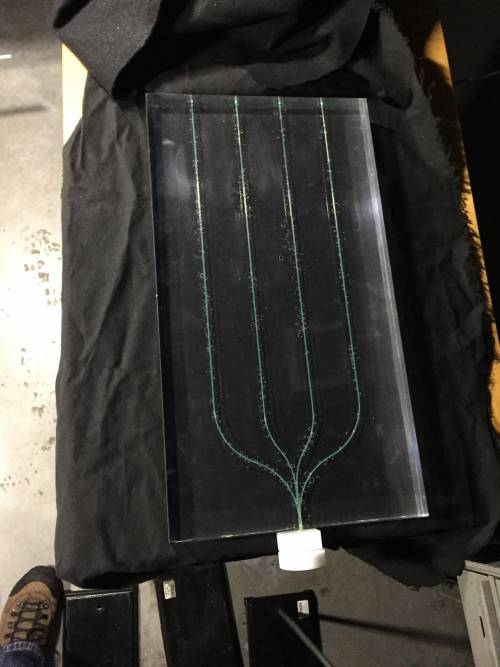
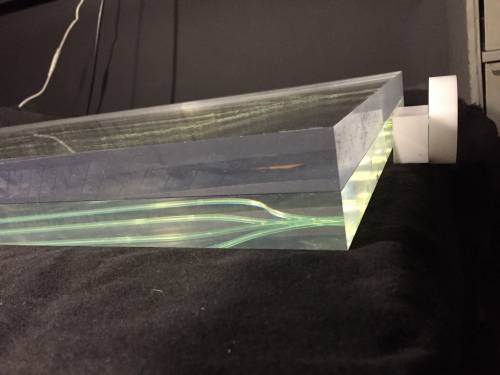
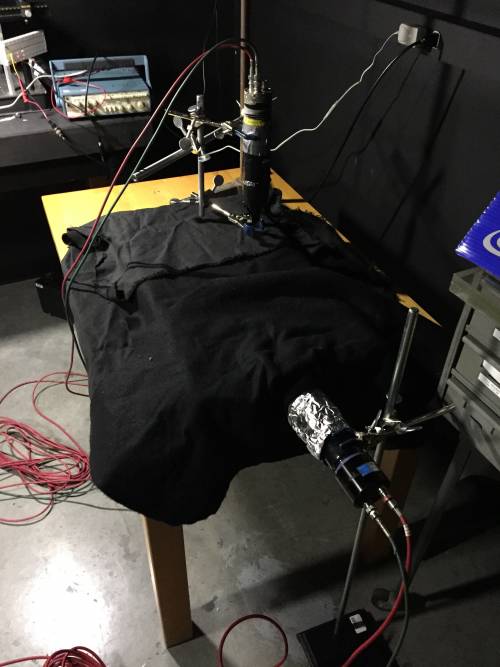
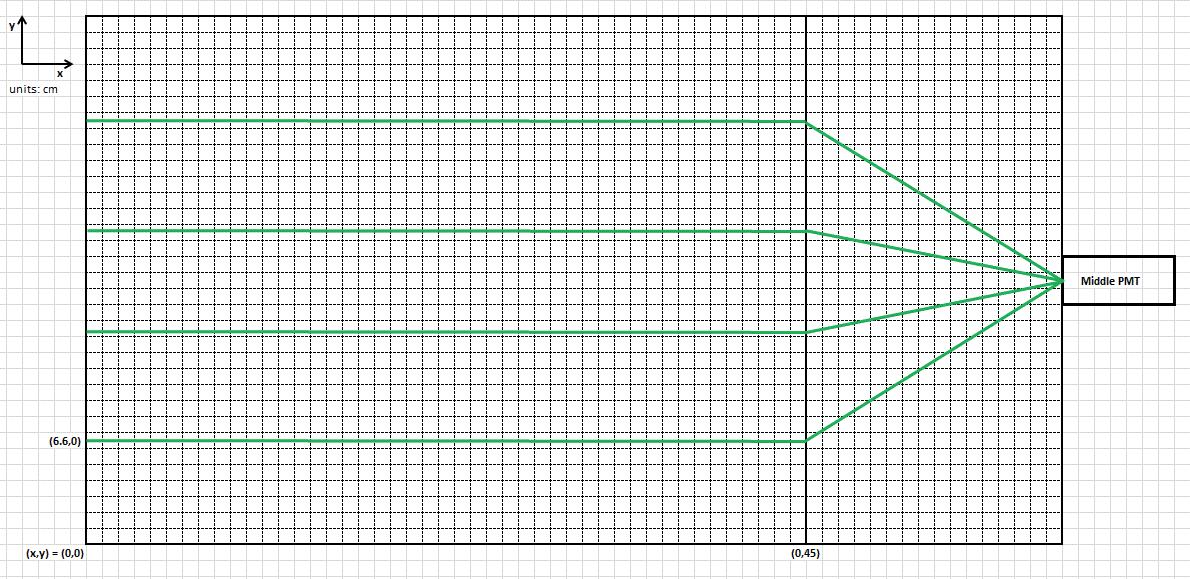
One sheet of Saint Gobain BC400 plastic scintillator (33cm x 61cm) with implanted WLS fibers was placed on top of black cloth. Optical grease was placed along the fiber channels. A sheet of scintillator without fibers was placed on top. As can be seen in Figure 1a, air bubbles are present, but there was no way to eliminate them. Figure 2 shows the coordinate system used to make measurements on the scintillator sheets (data files have format of date_runType_scintillator_xLocation_yLocation.dat). The sheets were covered completely with black felt. Optical grease was applied to the face of the middle PMT which was then placed in the cap milled to hold the WLS fibers from the scintillator sheets. The bottom PMT was placed as shown in Figure 1c. Equal lengths of HV and BNC cables were connected to the ends of the existing cables used for PMT data collection.
The middle PMT was set to a -2200.V bias and the bottom PMT was set to a -1700.V bias. Discriminator units 1 and 4 were set to thresholds of -50.mV and -300.mV respectively, both with a 20nsec logic pulse width. The middle PMT signal was passed through unit 1 and the bottom PMT signal (connected to the “A” on the PMT) was passed through unit 4. This was because when using a -50.mV threshold on the bottom PMT, the majority of triggers were noise for the middle PMT. The outputs were passed through a coincidence unit with a 40nsec coincidence window.
On the scope, Input 1 was connected to the bottom PMT signal (1 MOhm DC termination), Input 2 was connected to nothing, Input 3 was connected to the middle PMT signal (1 MOhm DC termination), and Input 4 was connected to the coincidence unit output (50 Ohm DC termination). The scope was triggered using Input 4 at -500.mV (half-max of logic pulse). The scale for the bottom PMT was set to 500 mV/div while the middle PMT scale was set to 100 mV/div. Each run lasted 15 minutes.
| Figures 1a, 1b, 1c: Na-22 Run Setup |
 |
 |
 |
| Figure 2: Coordinate System Used To Make Measurements |
 |
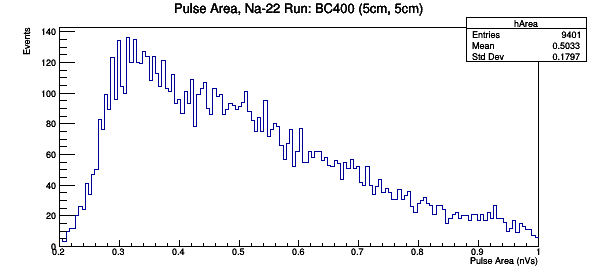
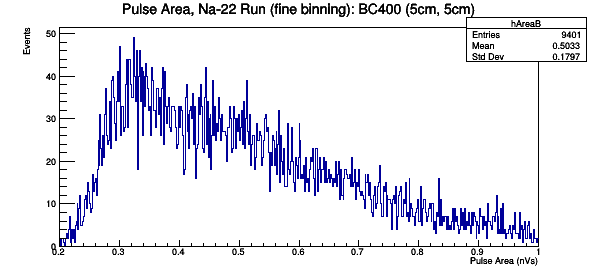
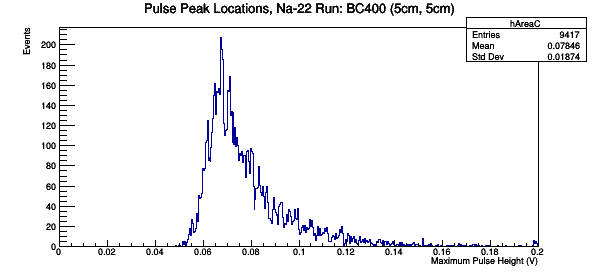
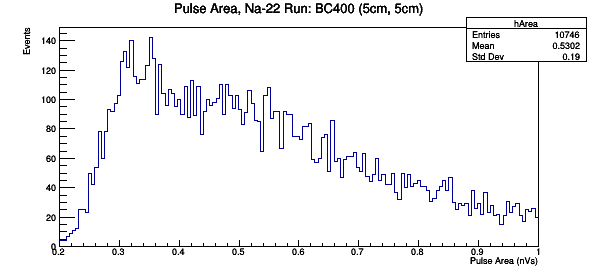
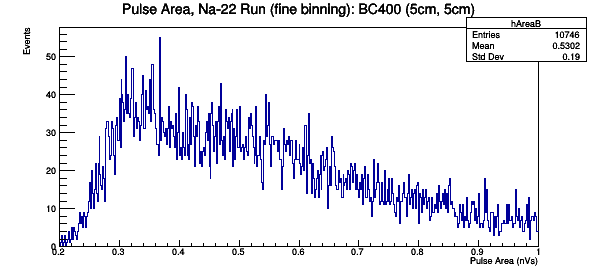
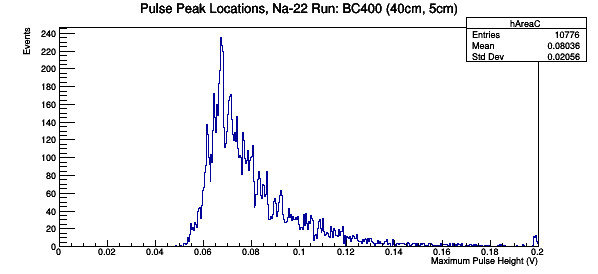
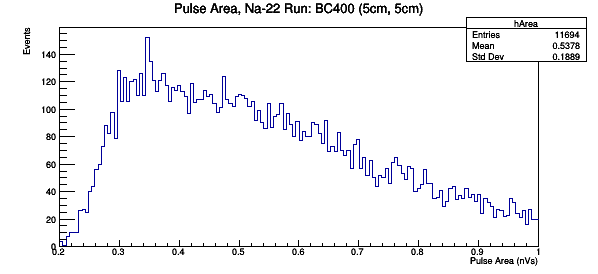
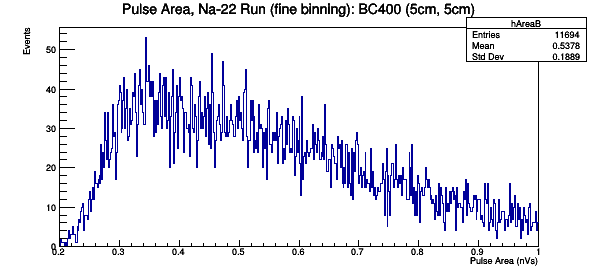
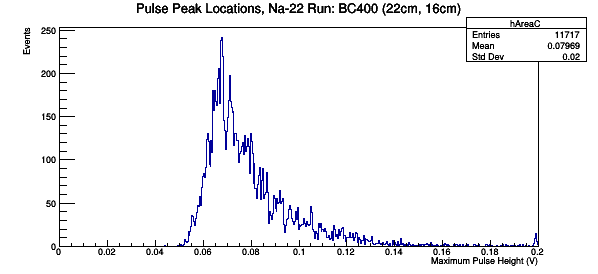
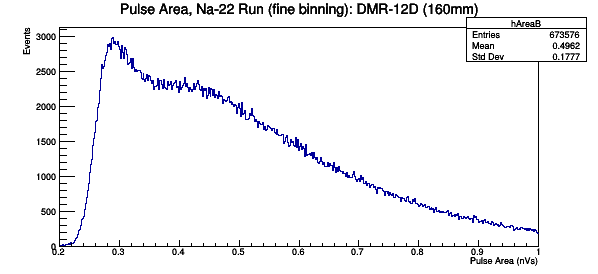
Three different graphs were created for each sample: one with 150 bins, one with 300 bins, and one showing the pulse peak location. The reduction code and root analysis code can be found in the CDMS_restricted folder.