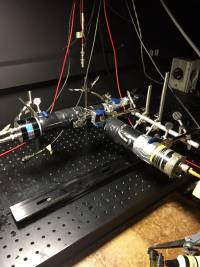
Each sample wrapped in PTFE tape was connected to the face of PMT R1332 (“middle PMT”) using PST-841 O-ring lubricant. It was then wrapped using aluminum foil and electrical tape. Generic scintillator (4.5cm x 1cm x 2cm) was connected to PMT 8575B (“bottom PMT”) in a similar fashion. A sodium-22 source was positioned between the two scintillators as shown in Figure 1.
The middle PMT was set to a -2000.V bias and the bottom PMT was set to a -1700.V bias. Discriminator units 1 and 2 were set to a threshold of -50.mV and a 20nsec logic pulse width. The middle PMT signal was passed through unit 1 and the bottom PMT signal (connected to the “A” on the PMT) was passed through unit 2. The outputs were passed through a coincidence unit with a 40nsec coincidence window.
On the scope, Input 1 was connected to the bottom PMT signal (1 MOhm DC termination), Input 2 was connected to nothing, Input 3 was connected to the middle PMT signal (1 MOhm DC termination), and Input 4 was connected to the coincidence unit output (50 Ohm DC termination). The scope was triggered using Input 4 at -500.mV (half-max of logic pulse).
| Figures 1a and 1b: Na-22 Run Setup |
 |
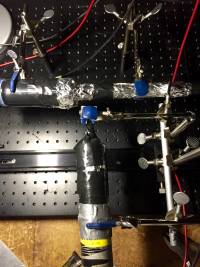 |
| Note: These figures show the cemeted-together DMR-12 sample whereas the measurements were run on the individual scintillators. |
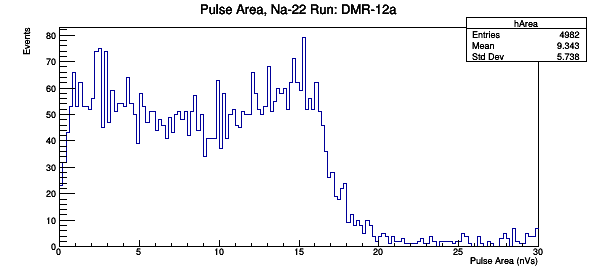
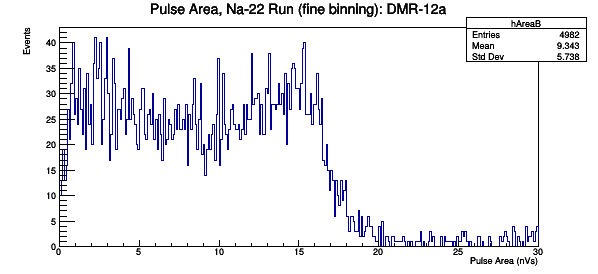
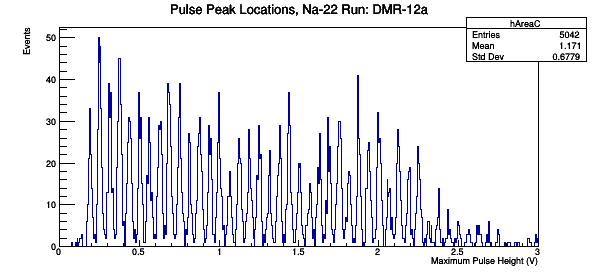
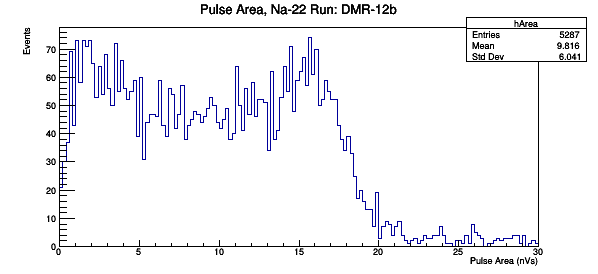
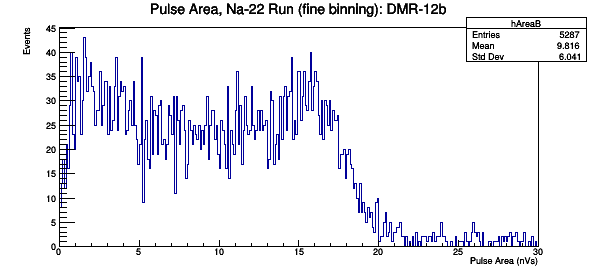
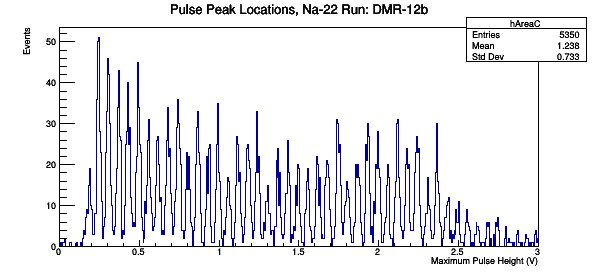
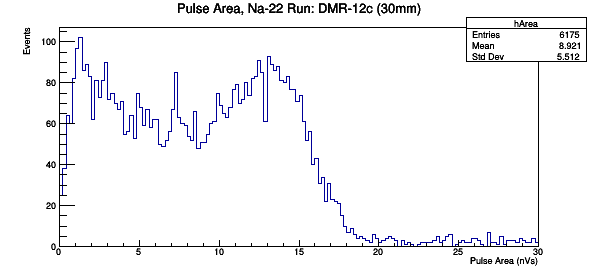
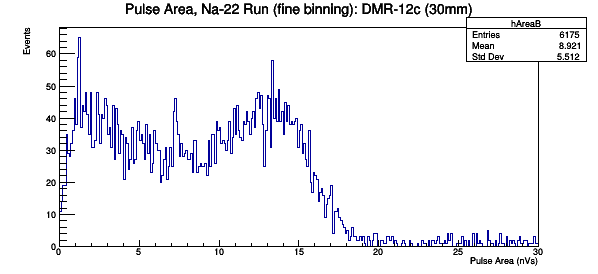
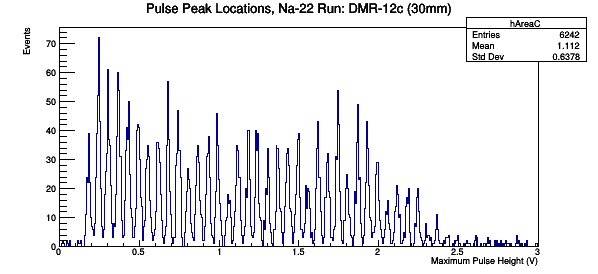
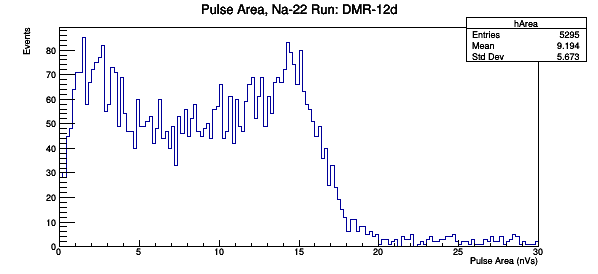
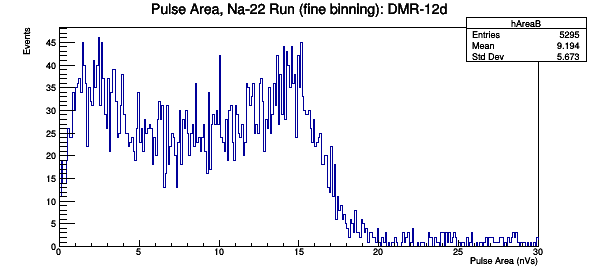
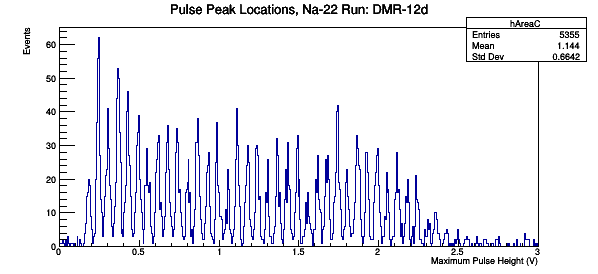
Three different graphs were created for each sample: one with 150 bins, one with 300 bins, and one showing the pulse peak location. The reduction code and root analysis code can be found in the CDMS_restricted folder.