−Table of Contents
Muon Spectrum
Good news: As far as I can tell, choosing 4 GeV for the muon energy versus sampling from a spectrum seems to have made little impact on the light output as compared to using a more realistic muon spectrum. Specifically, I created a muon spectrum (pretty finely sampled; about 35 points or so) using the a muon spectrum given by the PDG (Fig. 24.4). I used this to generate muon energies, then ran a standard simulation using PTFE_R=0.99, BulkAttLeng=2.5m, and taking values at 1,3,5,7,9 cm as usual. The results, and comparison to the previous results, are shown below:
| Measurement position/Energy | PE Counts | Sigma |
|---|---|---|
| 1 cm, 4 GeV | 2272 +/- 18 | 246 +/- 23 |
| 1 cm, Spectrum | 2333 +/- 14 | 301 +/- 18 |
| 3 cm, 4 GeV | 1988 +/- 31 | 300 +/- 53 |
| 3 cm, Spectrum | 1986 +/- 13 | 233 +/- 21 |
| 5 cm, 4 GeV | 1746 +/- 17 | 268 +/- 23 |
| 5 cm, Spectrum | 1753 +/- 9 | 205 +/- 10 |
| 7 cm, 4 GeV | 1573 +/- 8 | 185 +/- 11 |
| 7 cm, Spectrum | 1585 +/- 8 | 172 +/- 8 |
| 9 cm, 4 GeV | 1527 +/- 16 | 204 +/- 24 |
| 9 cm, Spectrum | 1517 +/- 7 | 177 +/- 6 |
4 GeV Attenuation length: 18.0 +/- 0.4
Spectrum Attenuation Length: 19.0 +/- 0.3
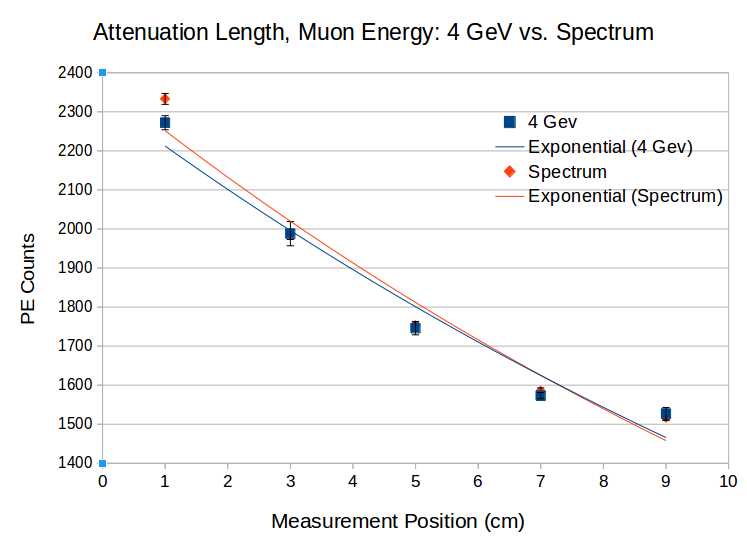
The only case where the muon PE counts differ substantially is at the 1 cm measurement. You'd think this discrepancy is what caused the change from 18.0 → 19.0 in the attenuation length calculation. However, this difference is effectively shared between the PE difference at 1cm and the much smaller error for the 9 cm measurement (7 vs. 16). Overall, it's not clear that using this more realistic muon spectrum would create substantially different results for our data. We could regenerate everything using this change just to be safe, but we could also argue that it's not necessary.
WLS Trapping
According to simulations run on the Al-masked trial with the following parameters, we find a few interesting statements: (collected by running photon_nondegenerate.C (in sim/HannahTestStand/macros) on /data/cdms1/schmitz/condor_output/HannahTestStand/data/paper/muon6/Al100R995Hole1p05mm/EURECA.root)
Parameters
PTFE Reflectivity = 0.995
Al Mask Reflectivity = 1.00
Bulk Attenuation Length = 2.5 m
Al Hole size: 1.05 mm (fiber size: 1.03 mm)
Results, embedded WLS fiber
# of photons generated (one per generation): 30196665
Percentage of photon tracks, one per generation, which were eventually wavelength shifted: 13366059/30196665 = (44.26 +/- 0.01)%
# of WLS photons which reached the PMT via the fiber: 2336496
# of photons which reached the PMT via the fiber: 2687262
# of non-WLS photons which reached the PMT via the fiber: 350766
Percentage of photons which reached the PMT via the fiber and were not WLS photons: (13.05 +/- 0.01)%
Percentage of photons which reached the PMT via the fiber-hole: 8.90 +/- 0.01% (269 +/- 9 per muon)
Results, no WLS fiber
# of photons generated (one per generation): 31048174
# of photons which reached PMT via the fiber-sized hole: 874020
Percentage of photons which reached the PMT via the fiber-hole: 2.82 +/- 0.01% (87 +/- 3 per muon)
The ratio of 13% reflects both the probability that a blue photon is trapped in the fiber and propagated to the PMT, as well as the probability that a photon is directed straight for the Al Mask hole off of a reflection. We also see that this “factor of 3” statement remains true even after running a fresh simulation. Finally, as a note, an average photon (not double-counting) experience about 8 reflections before it's absorbed/its track dies. I might need to look at this number more closely and investigate what's counted as a “reflection,” but that's the rough statement by just looking at the “number of reflections” parameter currently defined in the sim.