Shannon's Histograms
Preliminary Graphs
Some preliminary graphs from basic monte carlo simulations of a beam 1 GeV neutrons hitting a target of polystyrene loaded with 1% gadolinium with a block of lead either in front or behind the poly. In each case run, the poly and lead both have widths and heights of 50 cm. The poly has a thickness of 1 m and the thickness of the lead was varied.
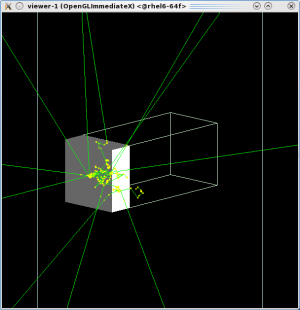
Below is the layout of the simulation with a 20 cm thick block of lead in front of the poly
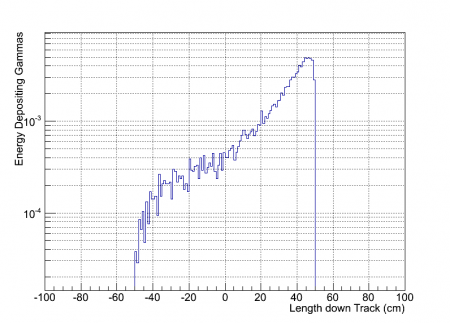
Length: point at which the gamma first interacted with the poly along the axis of the “thickness” of the block, normalized so that zero is at the center of the poly block and neutrons are thrown from the positive direction to the negative direction.
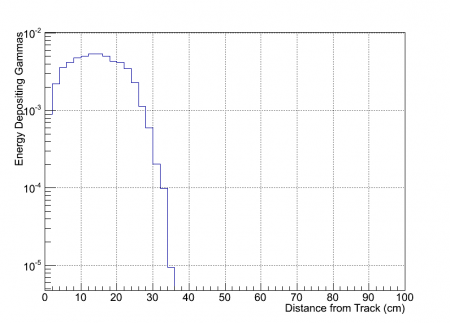
Distance: point at which the gamma first interacted with the poly as a distance in both height and width directions radially from the center of the block.
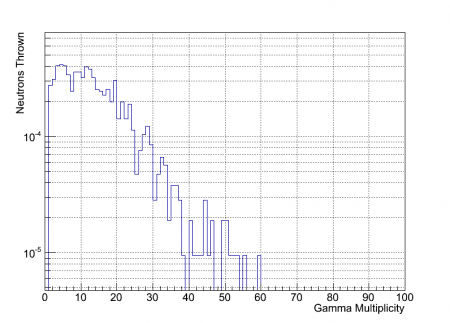
Gamma Multiplicity: gammas formed per neutron thrown
Time from First Light: time from when the first neutron was thrown to when the gamma interacted with poly
Below are preliminary graphs of length, distance, multiplicity, and time per neutron thrown for 1000 events for this layout
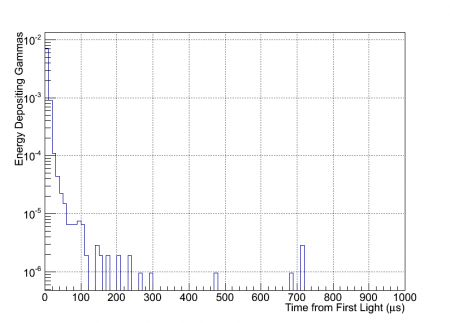
Capture Time and Position Graphs
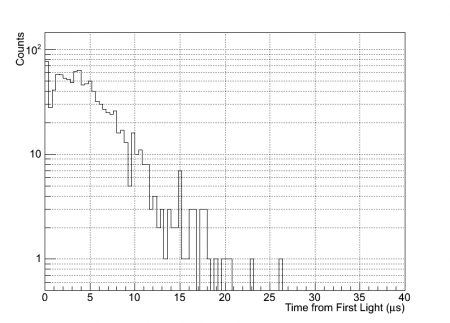
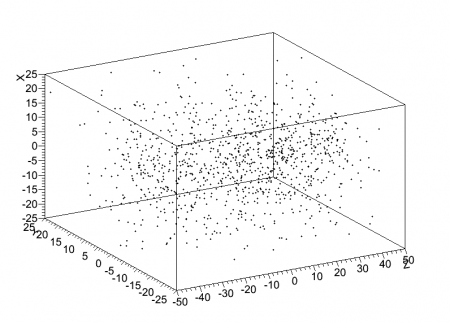
Below are the graphs of where and when neutrons are captured in the poly. They are for 1 GeV neutrons going into the poly with no lead block. In the position graph, the beam of neutrons is coming from the right. Also in the position graph, the dimensions of the graph are the same as that of the poly block, thus the axes of the graph define the edges of the box. These do not currently distinguish between what element the neutron captures on.
Energy Graphs
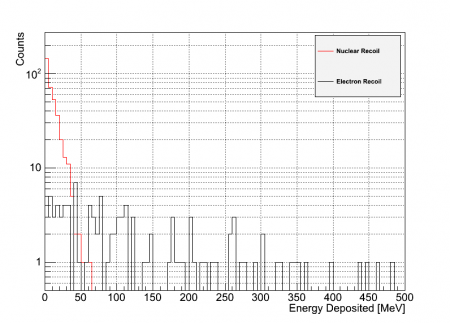
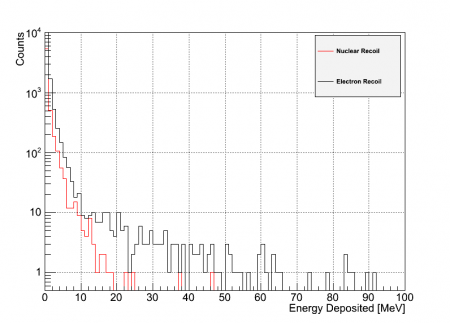
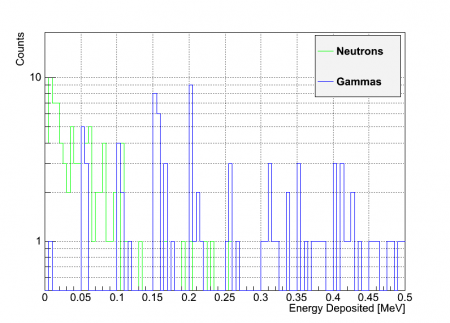
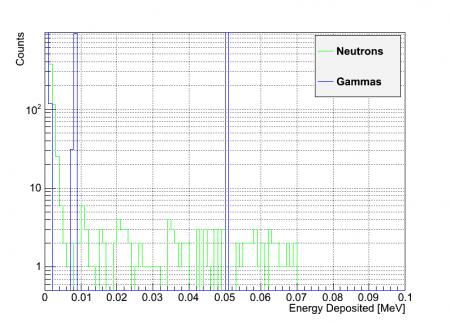
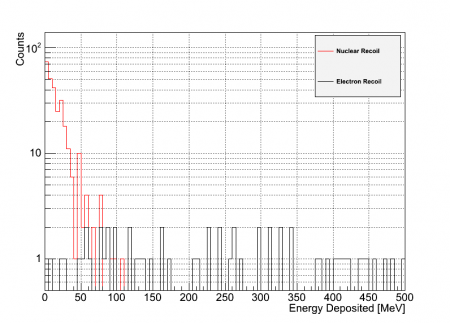
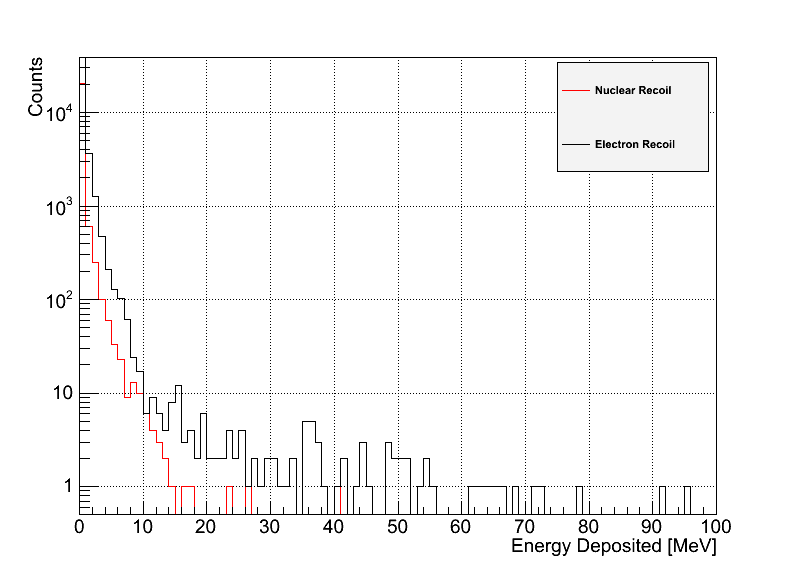
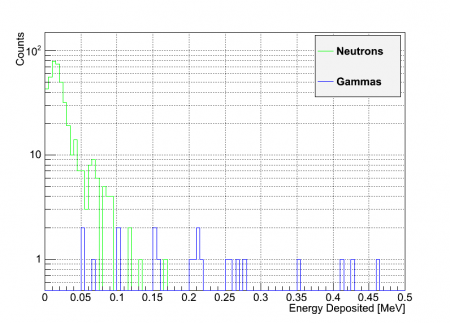
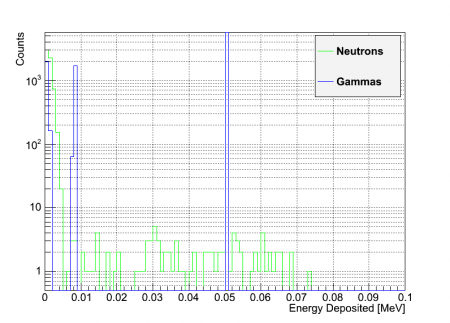
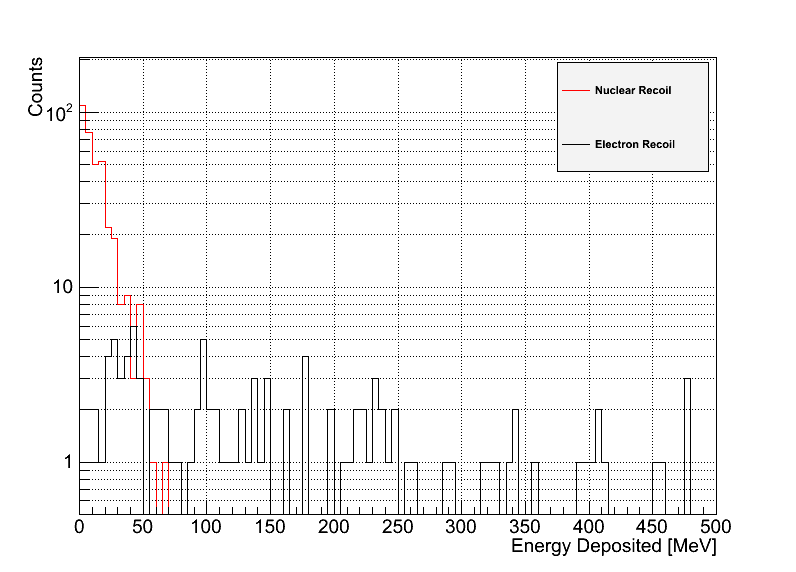
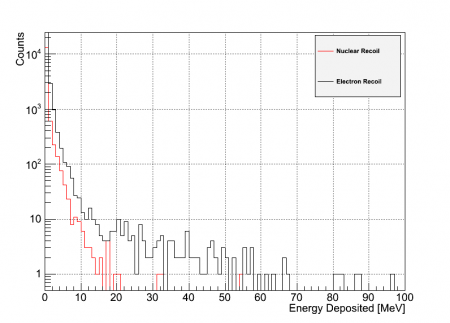
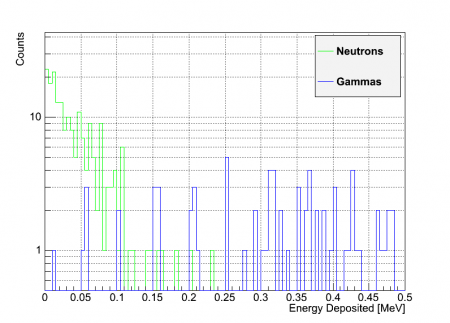
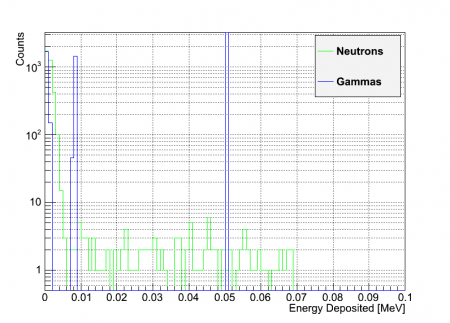
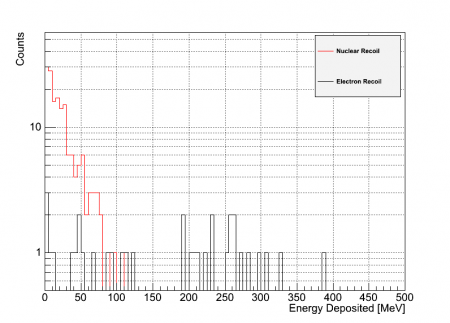
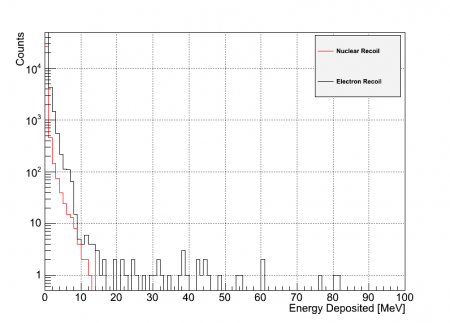
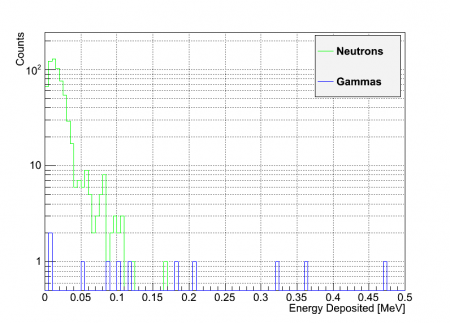
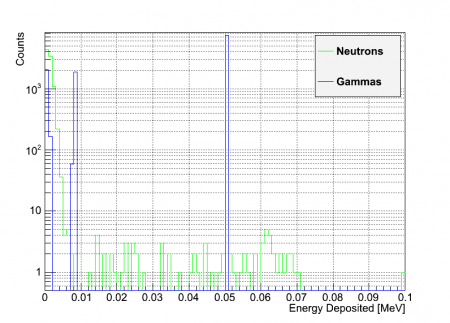
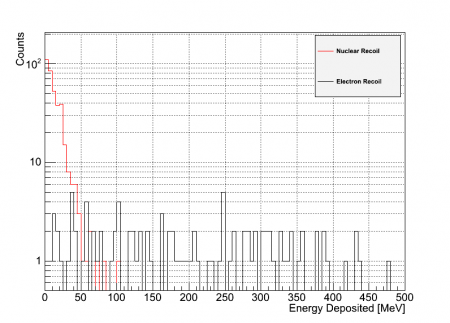
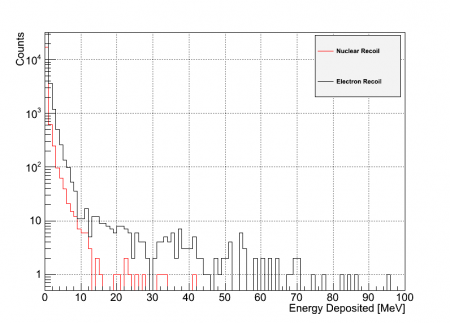
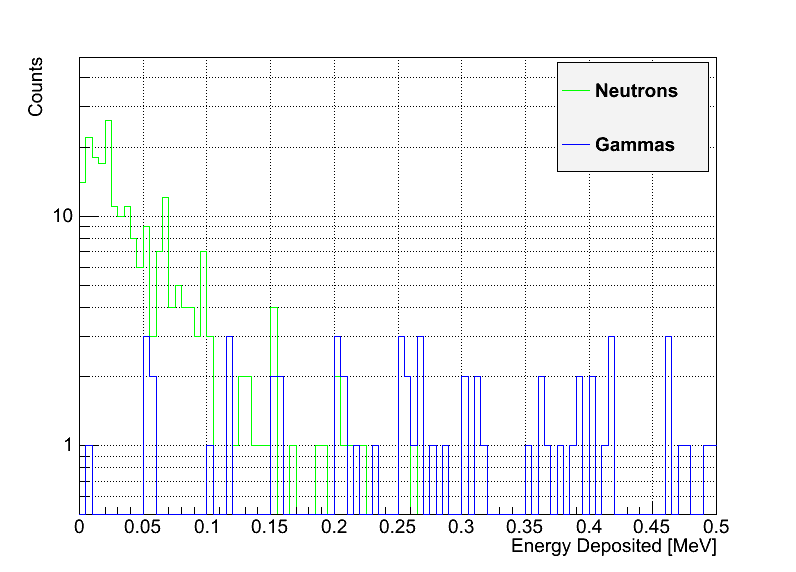
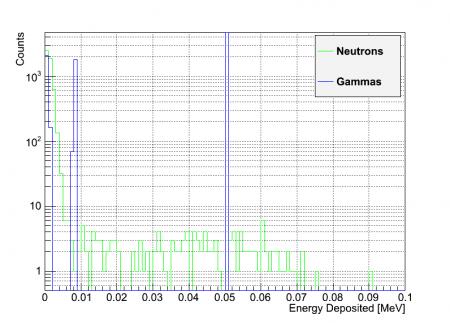
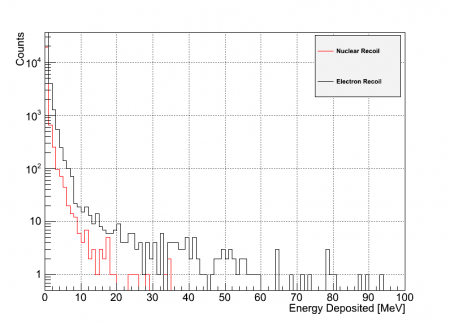
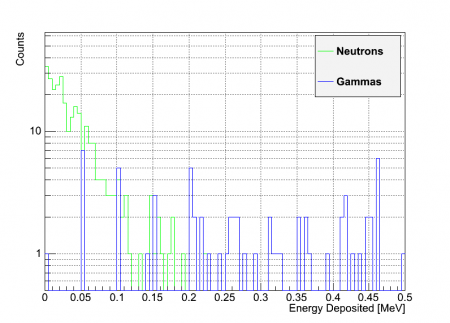
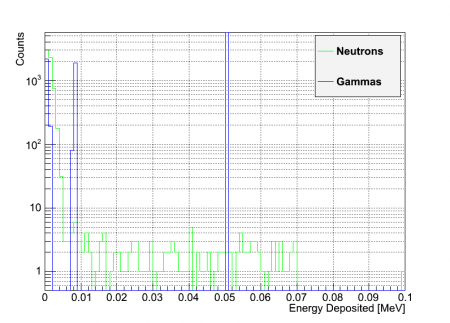
Below are the energy deposited graphs for various thicknesses of lead in front of and behind the poly block. In all cases 1000 neutrons of energy 1 GeV were thrown. Graphs of energy deposition of the neutrons and gammas are shown as well as a comparison of the electron recoil energies to the neutron recoil energies.
No lead
| Summed over event | Summed over individual tracks |
|---|---|
 |  |
 |  |
10 cm of lead
In front of poly block
| Summed over event | Summed over individual tracks |
|---|---|
 |  |
 |  |
Behind poly block
| Summed over event | Summed over individual tracks |
|---|---|
 |  |
 |  |
20 cm lead
In front of poly block
| Summed over event | Summed over individual tracks |
|---|---|
 |  |
 |  |
Behind poly block
| Summed over event | Summed over individual tracks |
|---|---|
 |  |
 |  |
50 cm lead
In front of poly block
| Summed over event | Summed over individual tracks |
|---|---|
 | 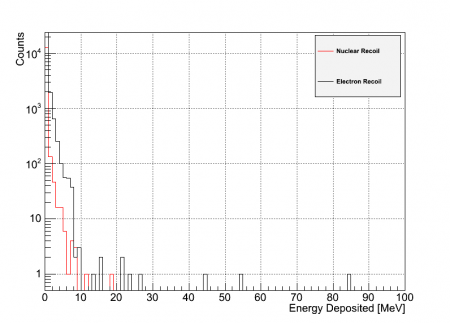 |
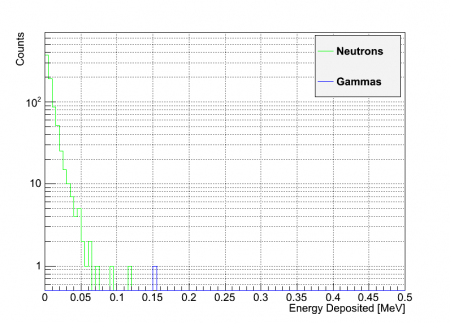 | 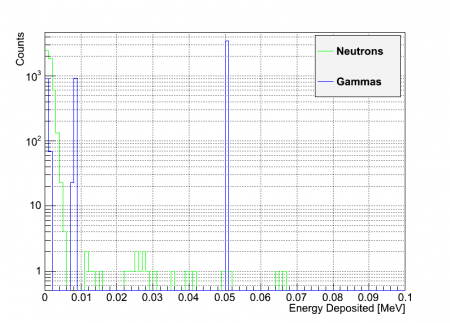 |
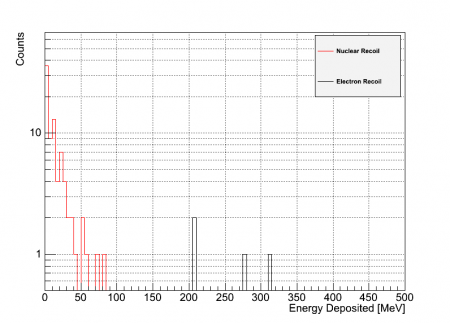
In the above case, few neutrons are reaching the poly and thus there is a low energy deposition from gammas because there are few gammas formed.
Behind poly block
| Summed over event | Summed over individual tracks |
|---|---|
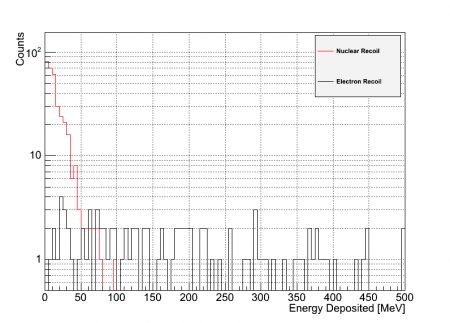 |  |
 |  |
Comparisons of Multiplicity and Recoil Energies between thicknesses and locations of lead
All are for 1000 neutrons thrown of energy 1 GeV
Note: Not all x axes scaled the same
Neutron Multiplicity
| Location | 0 cm | 10 cm | 20 cm | 50 cm |
|---|---|---|---|---|
| Front | 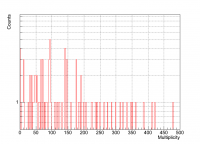 | 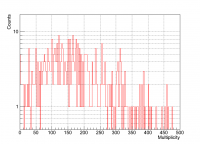 | 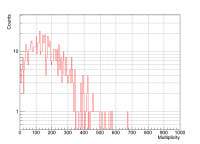 | 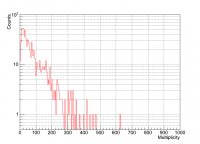 |
| Back | N/A | 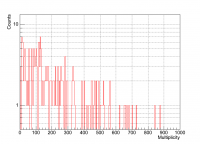 | 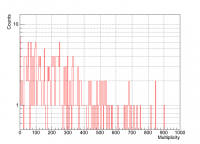 | 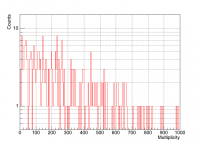 |
Gamma Multiplicity
| Location | 0 cm | 10 cm | 20 cm | 50 cm |
|---|---|---|---|---|
| Front | 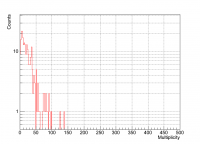 | 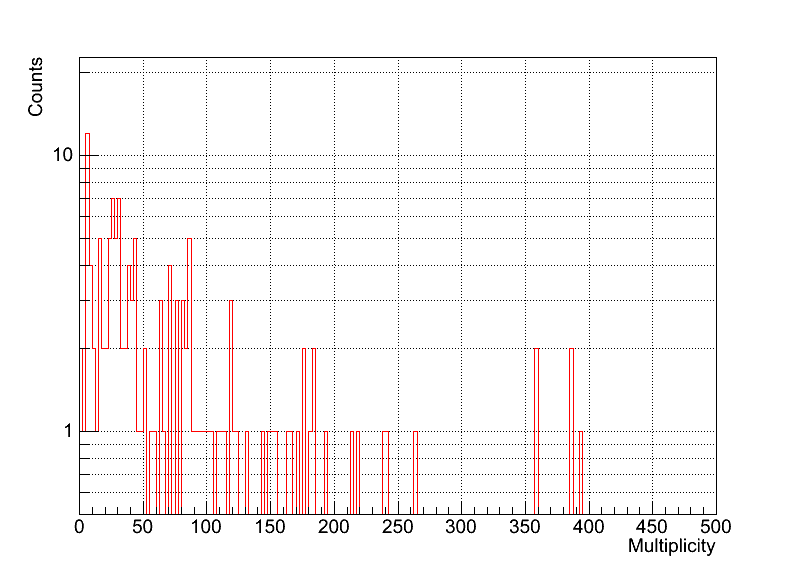 | 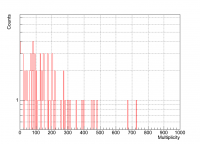 | 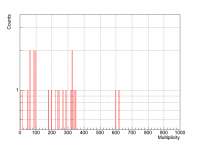 |
| Back | N/A | 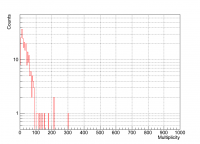 | 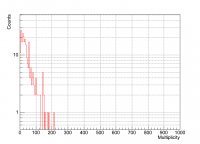 | 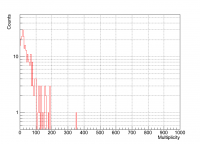 |
Nuclear Recoil Energies (summed over event)
| Location | 0 cm | 10 cm | 20 cm | 50 cm |
|---|---|---|---|---|
| Front | 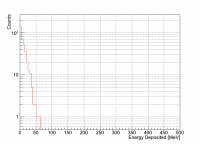 | 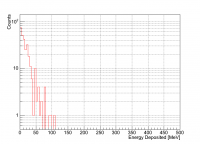 | 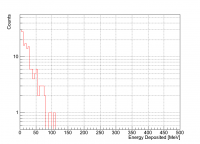 | 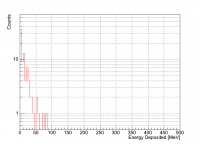 |
| Back | N/A | 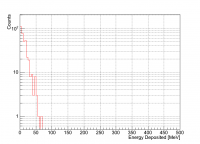 | | |
Electron Recoil Energies (summed over event)
| Location | 0 cm | 10 cm | 20 cm | 50 cm |
|---|---|---|---|---|
| Front | 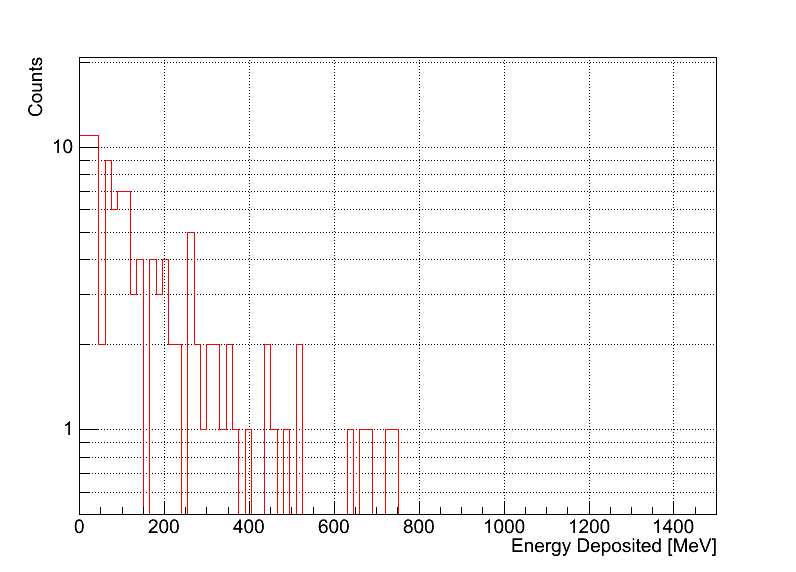 | 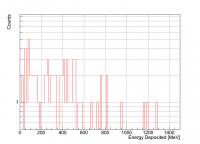 | 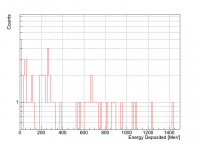 | 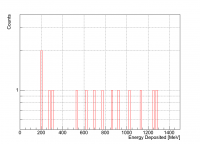 |
| Back | N/A | 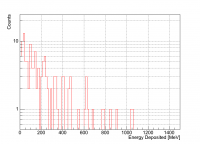 | 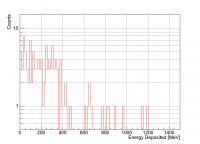 | 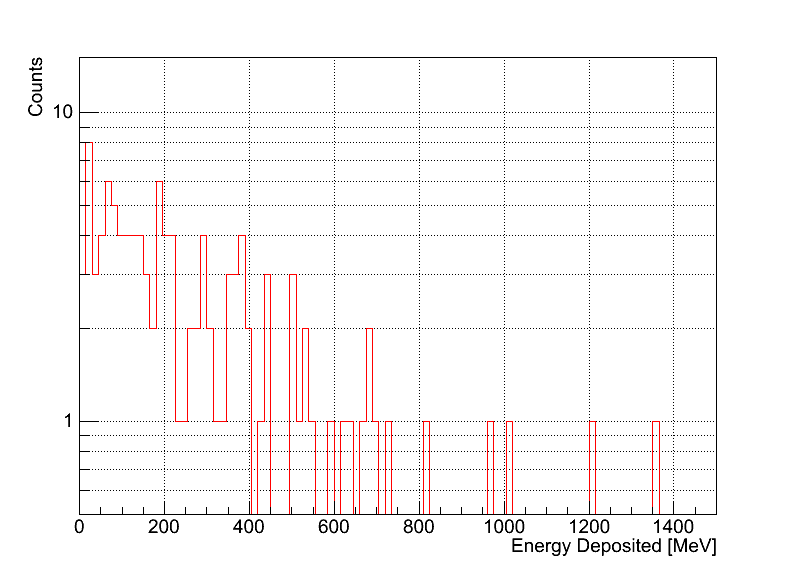 |