Table of Contents
Run 47
The final run in the old laboratory was dedicated to testing G112, an iZIPv6 p-type crystal from Ortec, fabricated by TAMU. Due to time constraints from the imminent laboratory relocation, full detector characterisation tests were not performed. However, critical temperatures of the TESs were measured, charge breakdown was investigated and some short, ionisation-only data was acquired at various biases. A mixing chamber temperature of 63 mK was achieved during this run. The setup is summarised in Table 1.
| Table 1: Run 47 setup | |||
|---|---|---|---|
| Detector | G112 | ||
| Tower | T1 | ||
| DIB | 1 | 2 | 3 |
| Face | 2 | 5 | 6 |
| Side coax | ZB1-4-6 | ZB1-4-8 | ZB1-4-4 |
| SQUET | ZC23 | ZC70 | ZC13 |
| Stripline | #19 | #20 | #21 |
| Readout | DCRCv3 | ||
| Source | 1 x Am-241 & 1 x Pb-210 | ||
Electrical Problems
Upon installing the assembled tower in the cryostat, a short between the phonon channels and ground was found during an electrical check. As germanium conducts at room temperature, one short can lead to all phonon channels appearing to be connected to ground. After some investigation, socket 5 (QET C) on tower face 6 (connected to DIB 3) was found to be loose and therefore coming into contact with the copper tower. Due to the way the tower is constructed, it is impossible to fix this problem without stripping out the entire face. As tower faces 1 & 3 fail continuity checks or feature loose sockets, loosing tower face 5 means that iZIPv6 detectors cannot be tested with the current tower. Therefore, a replacement tower is required.
Due to the lack of time, it was decided to proceed with the run regardless. At the very worst, phonon channel C on DIB 3 would be lost due to the short. Upon reaching liquid helium temperatures, shorts between the phonon channels on DIBs 1 & 2 disappeared as expected. At 4.2 K, a conductivity of 1-2 nS between the QET lines on DIB 3 and ground was measured. This was low enough to not severely impact the run.
Cryogenic Problems
The first attempt to cool down failed due to a leak between the main bath and IVC through the bottom indium seal at liquid nitrogen temperatures. Lowering the dewar and tightening the screws around the seal solved the problem.
The tower thermometer returned temperatures approximately 120 mK higher than the mixing chamber thermometer. One possible explanation was that the tower was accidentally thermally anchored to the cold plate. However, it was unlikely as this was quite difficult to achieve during installation. It was more likely that the wires attached to the thermometer came loose and required repair. This was confirmed after warming up, and uninstalling and disassembling the tower.
For the purposes of this run, all temperatures are quoted from the mixing chamber thermometer.
Critical Temperature & IbIs Measurements
Critical temperatures of G112's phonon channels as measured by the mixing chamber thermometer are given in Table 2. The mixing chamber heater is used to control the temperature of the mixing chamber, and measurements are performed by moving from the normal region to the superconducting region.
| Table 2: Critical Temperatures of G112 Phonon Channels as measured by mixing chamber thermometer. | ||
|---|---|---|
| Channel | Normal to Transition Temperature [± 0.2 mK] | Transistion to Superconducting Temperature [± 0.2 mK] |
| Crystal Face 1 | ||
| B1 | 81.7 | 81.2 |
| A1 | 81.7 | 81.2 |
| C1 | 139.0 | 120.0 |
| C2 | 76.7 | 76.0 |
| C3 | 79.9 | 73.8 |
| D2 | 77.7 | 76.0 |
| Crystal Face 2 | ||
| B3 | 81.8 | 76.7 |
| D1 | 79.1 | 78.0 |
| D3 | 81.7 | 77.7 |
| A3 | 76.1 | 71.9 |
| A2 | 75.0 | 72.1 |
| B2 | 73.5 | 71.5 |
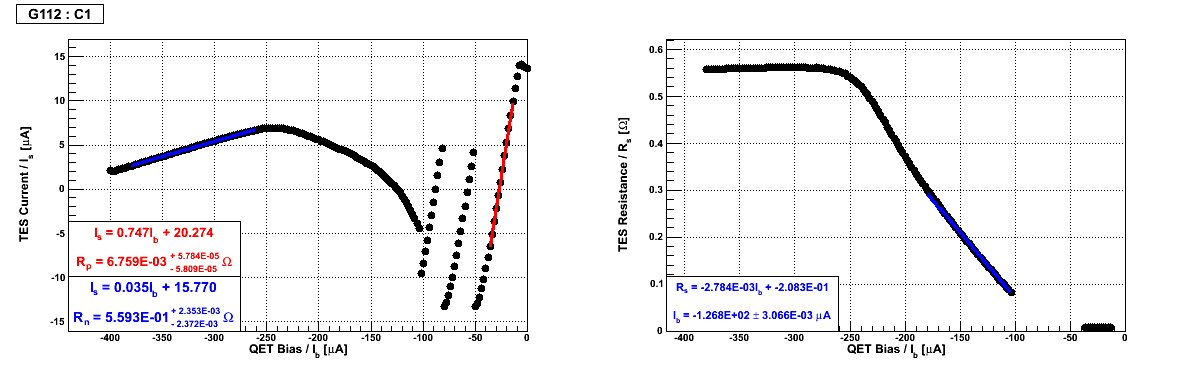
The critical temperatures for most channels lie between 71 mK and 82 mK, showing good uniformity between crystal faces. Channel C on DIB 1 is the exception, having a critical temperature significantly higher than its neighbours. This is confirmed when comparing the IbIs curve for phonon channel C1 in Fig. 1 with that from other channels, such as its next-door neighbour phonon channel C2 in Fig. 2. As shown, a current bias of higher magnitude is required to push C1 into the transition region.
Unfortunately, time constraints prevented a more thorough examination of the possible reasons for this. In other words, the IbIs curve was not reacquired after changing the SQUET card or DCRC. However, this feature is not apparent in previous runs with other crystals using various combinations of DCRCs and SQUET cards. Additionally, the phonon sensor works for all intents and purposes; it simply requires a higher current bias to reach the transition region. It is likely that this behaviour is simply a result of the fabrication process.
The complete set of IbIs curves is given in the Run Diary (2014/06/09).
| Figure 1: IbIs Curve for Phonon Channel C1 on Crystal Face 1. |
|---|
 |
| Figure 2: IbIs Curve for Phonon Channel C2 on Crystal Face 1. |
|---|
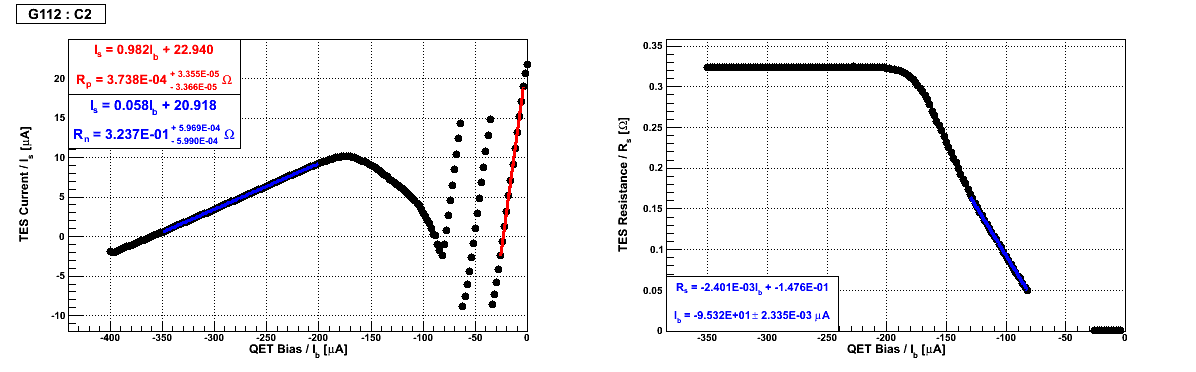 |
The parastic (Rp) and normal (Rn) resistances derived from the IbIs curves for G112's phonon channels are given in Table 3. The error on these values is given by the fits to the line, and are rather subjective. The parasitic resistances for phonon channels on DIB 3 are a factor of around 5 higher than those from other DIBs. This is because the IbIs curves are obtained using the DCRC Rev. C.1 board (DCRC50) for DIB 3. This is a known issue. Additionally, the bias currents (Ib) where Ib = Rn/4 are listed for each phonon channel in Table 3.
| Table 3: Parastic (Rp) & Normal (Rn) Resistances of G112 Phonon Channels from IbIs Curves, and Bias Current (Ib) where Ib = Rn/4. | |||
|---|---|---|---|
| Channel | Rp [mΩ] | Rn [mΩ] | Ib [μA] |
| Crystal Face 1 | |||
| B1 | 8.5 ± 0.1 | 510 ± 3 | -102 |
| A1 | 5.8 ± 0.1 | 485 ± 1 | -106 |
| C1 | 6.8 ± 0.1 | 559 ± 2 | -127 |
| C2 | 0.4 ± 0.1 | 324 ± 1 | -95.3 |
| C3 | 48.8 ± 0.2 | 733 ± 4 | 73.0 |
| D2 | 9.2 ± 0.1 | 629 ± 3 | -104 |
| Crystal Face 2 | |||
| B3 | 53.2 ± 0.3 | 523 ± 3 | 84.2 |
| D1 | 8.9 ± 0.1 | 556 ± 2 | -95.8 |
| D3 | 54.6 ± 0.2 | 500 ± 2 | 101 |
| A3 | 46.4 ± 0.1 | 496 ± 1 | 50.7 |
| A2 | 10.3 ± 0.2 | 764 ± 6 | -81.0 |
| B2 | 4.1 ± 0.1 | 858 ± 7 | -60.7 |
Charge Breakdown Measurements
| Table 4: Charge Breakdown Measurements for Various Crystals. | ||
|---|---|---|
| Potential at Charge Breakdown | ||
| Crystal | Side 1 Positive [V] | Side 1 Negative [V] |
| G101b | +/-11 V | -/+7 V |
| G103a | +/-4 V | -/+2 V |
| G106a | >+/-12 V | >-/+12 V |
| G112 | +/-3 V | -/+4 V |
As listed in Table 4, charge breakdown in G112 was witnessed at +/-3 V and -/+4 V, where the first sign represents the polarity of Side 1's charge channels. This is similar to that measured for G103a, and both detectors were fabricated from Ortec boules as shown in Table 5. In general, the Ortec crystals do not hold charge well compared with their Umicore counterparts G101b and G106a. Although G103a is of a different orientation [111] to G112, both crystals are not only Ortec made but are also p-type. The manufacturers' quoted impurity concentrations in Table 5 would imply that the Ortec crystals have fewer impurities.
The charge breakdown values for G101b in Table 4 are from measurements performed in its spiral configuration. As a result only the charge signal was available. However, during all measurements, the ionisation traces have been more sensitive to charge breakdown than their phonon counterparts. It is not known why this is the case as the phonon channels should be more sensitive.
Therefore, it may be prudent to conduct tests on n-type Ortec crystals to see if they can hold charge better. Two detectors, the iZIPv6 G110 from TAMU and the 4Q device G108a from SLAC, would be suitable candidates. If G110 and G108a yielded similarly low biases at which charge breakdown is witnessed, the decision to use Ortec crystals for the SuperCDMS SNOLAB may have to reviewed as an electric field of sufficiently high strength could not be applied across them in their current state.
| Table 5: Properties of Detectors and their Boules. | |||||||
|---|---|---|---|---|---|---|---|
| Detector | Orientation | Boule | Manufacturer | Fabricator | Type | Impurity Concentration [cm-3] | Etch Pit Density [cm-2] |
| G101 | [100] | INTRI 5391 | Umicore | SLAC | N | 5.5E9 - 9.0E9 | 2400 - 3000 |
| G102 | [100] | INTRI 5392 | Umicore | SLAC | N | 9.0E9 - 1.5E10 | 3000 - 3816 |
| G103 | [111] | HP 50778 | Ortec | SLAC | P | 3.0E9 - 1.0E10 | <5000 |
| G106 | [100] | INTRI 5696 | Umicore | SLAC | N | 8.10E9 - 1.38E10 | 3183 - 4000 |
| G108 | [100] | HP 51058 | Ortec | SLAC | N | 5.31E9 - 7.22E9 | 5000 - 7800 |
| G110 | [100] | HP 51079 | Ortec | TAMU | N | 1.73E9 - 7.00E9 | 4680 - 6920 |
| G112 | [100] | HP 51085 | Ortec | TAMU | P | 2.20E9 - 6.12E9 | 4310 - 4930 |