Table of Contents
Run 28
Summary
Setup
| Table 1: Run 28 setup | ||
|---|---|---|
| Detector | G101b | |
| Tower | T1 | |
| DIB | 1 | 2 |
| Face | 2 | 5 |
| Side coax | ZB1-1-6 | ZB1-1-9 |
| SQUET | ZC23 | ZC70 |
| Stripline | #19 | #20 |
| Readout | DCRCv3 | |
Source plate is same as that used in previous 100 mm crystal runs. One Am-241 source facing Side 2 in Q2 position.
Initial Look at Pulses and Charge Breakdown Measurements
| Figure 1: Typical pulses from 0 V bias data series 07120513_1911 (1.6384 ms trace length). | ||
|---|---|---|
| Qi | Qo | |
| DIB 1 | 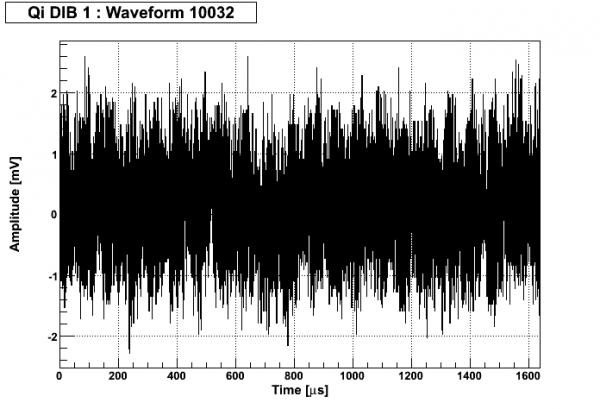 | 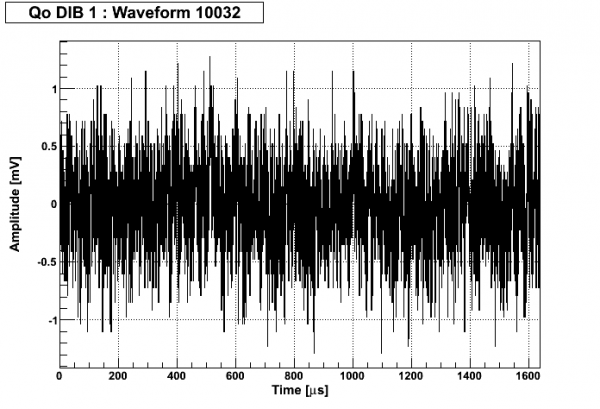 |
| DIB 2 | 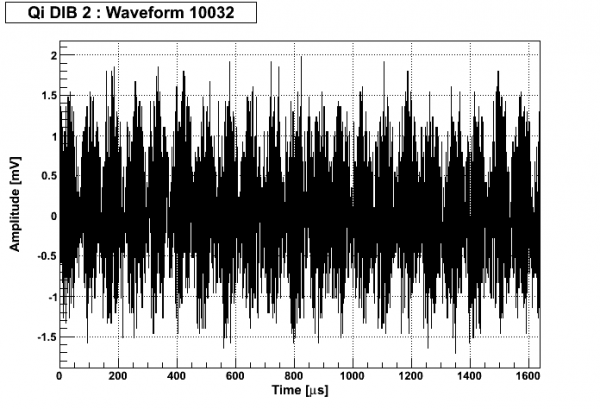 | 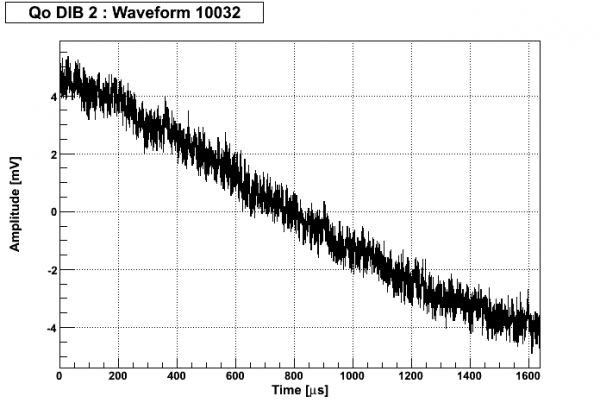 |
| Figure 2: Typical pulses from 0 V bias data series 07120513_1927 (26.2144 ms trace length). | ||
|---|---|---|
| Qi | Qo | |
| DIB 1 | 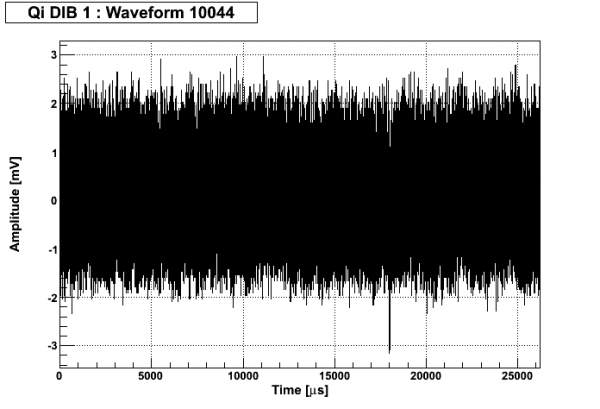 | 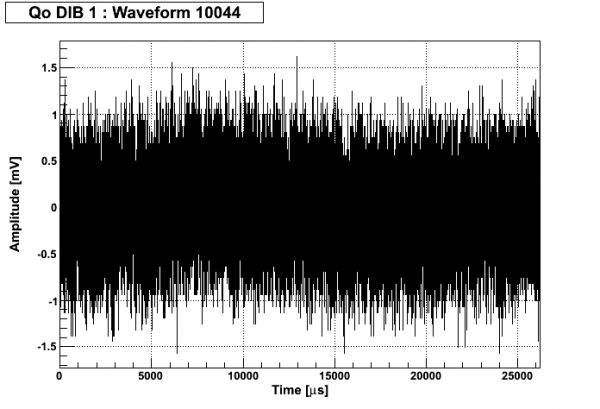 |
| DIB 2 | 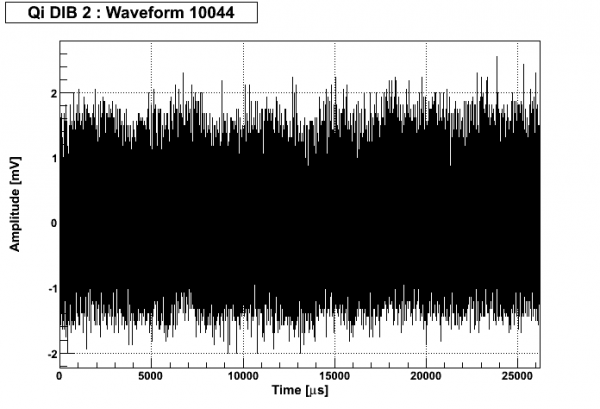 | 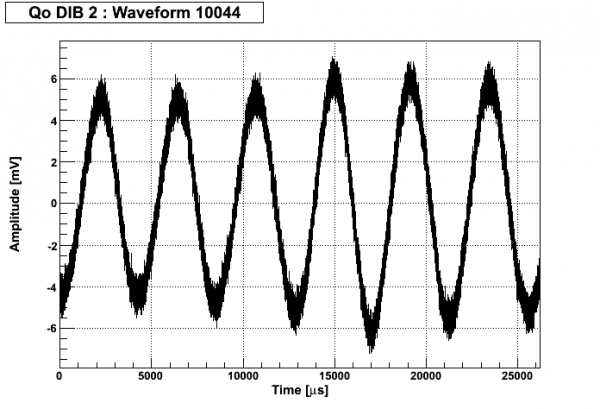 |
| Table 2: Summary of Charge Breakdown Measurements. | ||
|---|---|---|
| DIB 1 | DIB 2 | |
| DIB 1 negative | >-/+13.0 V | Hint at -/+7.0 V (Qi) |
| DIB 1 positive | >+/-13.0 V | Hint at +/-11.0 V (Qi) |
+/-4 V & -/+4 V Ba-133 Data Analysis
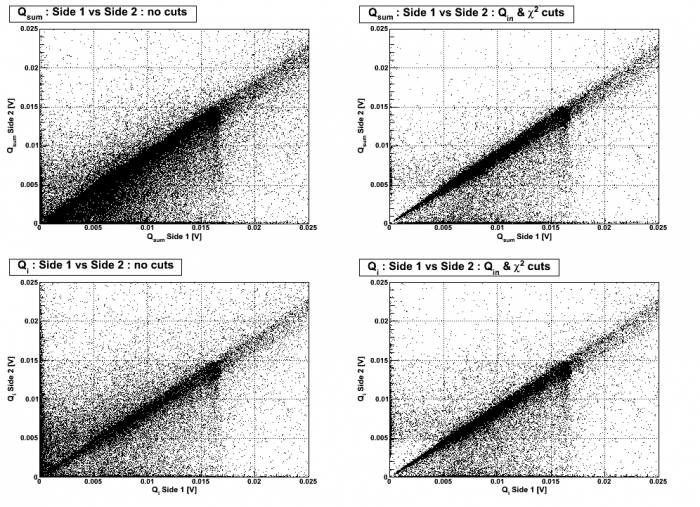
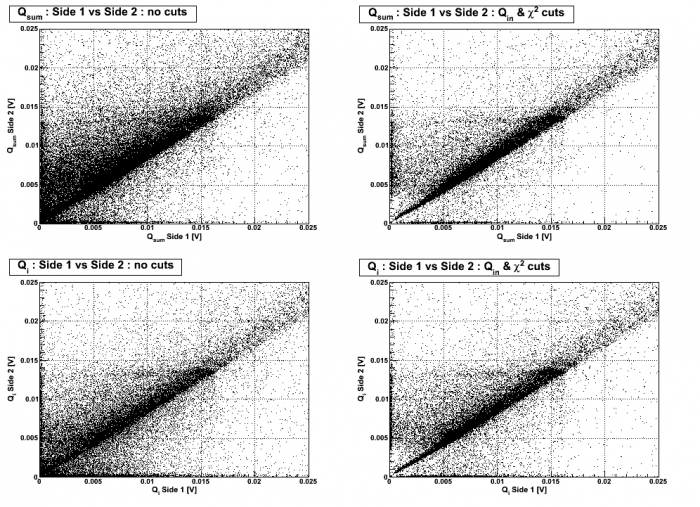
| Figure 3: Qsum (= Qi + Qo) Side 1 vs. Side 2 (top) & Qi Side 1 vs. Side 2 (bottom) after 500 seconds. | |
|---|---|
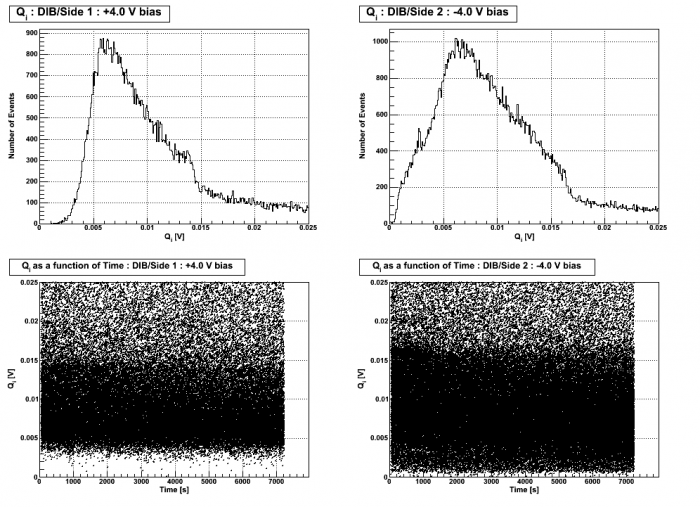
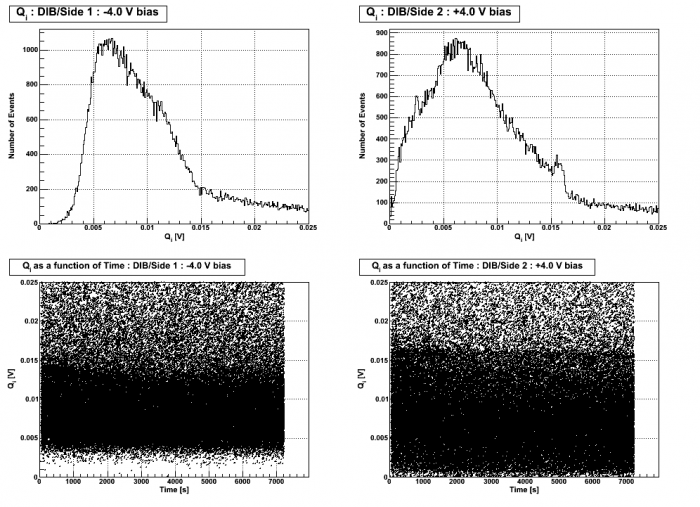
| Side 1 +4.0 V bias, Side 2 -4.0 V bias | Side 1 -4.0 V bias, Side 2 +4.0 V bias |
 |  |
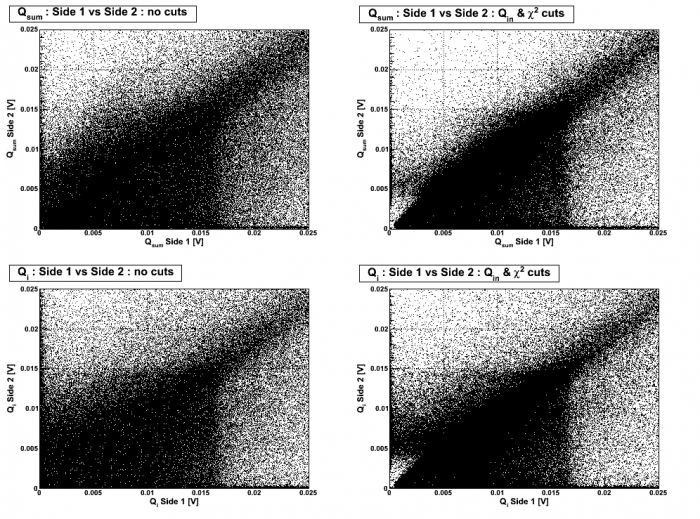
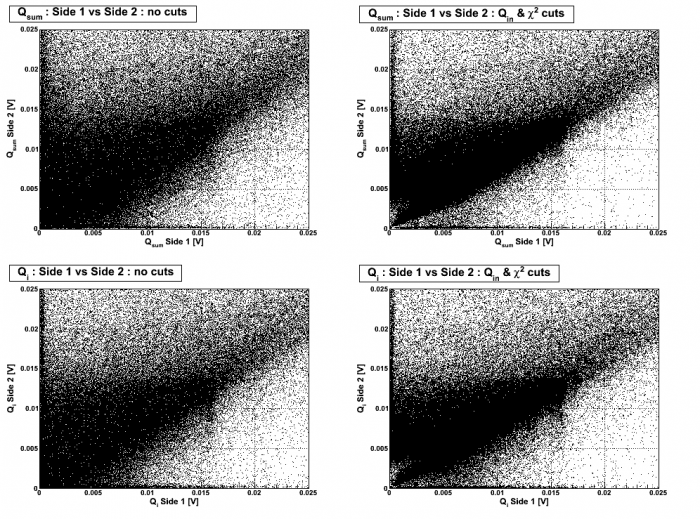
| Figure 4: Qsum (= Qi + Qo) Side 1 vs. Side 2 (top) & Qi Side 1 vs. Side 2 (bottom) after 50 minutes. | |
|---|---|
| Side 1 +4.0 V bias, Side 2 -4.0 V bias | Side 1 -4.0 V bias, Side 2 +4.0 V bias |
 |  |
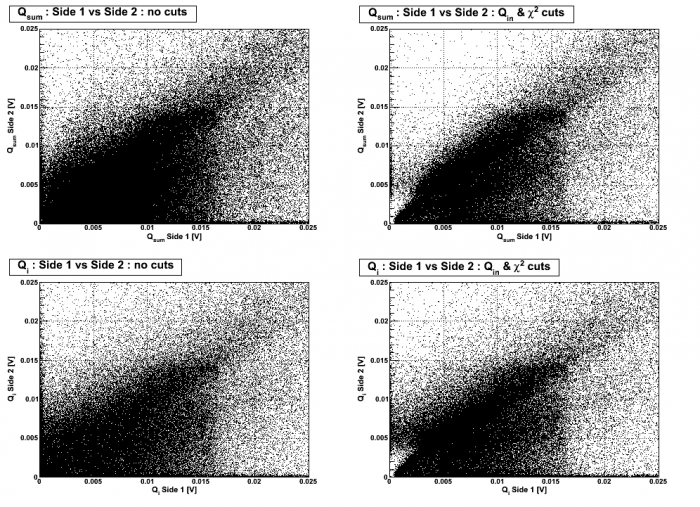
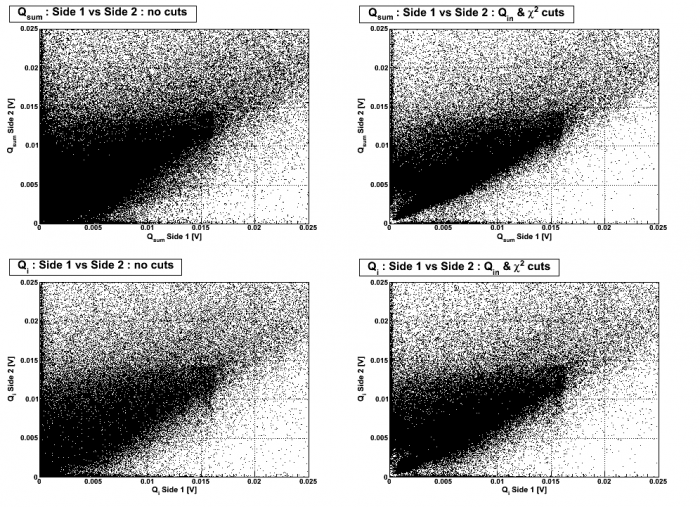
| Figure 5: Qsum (= Qi + Qo) Side 1 vs. Side 2 (top) & Qi Side 1 vs. Side 2 (bottom) after 2 hours. | |
|---|---|
| Side 1 +4.0 V bias, Side 2 -4.0 V bias | Side 1 -4.0 V bias, Side 2 +4.0 V bias |
 |  |
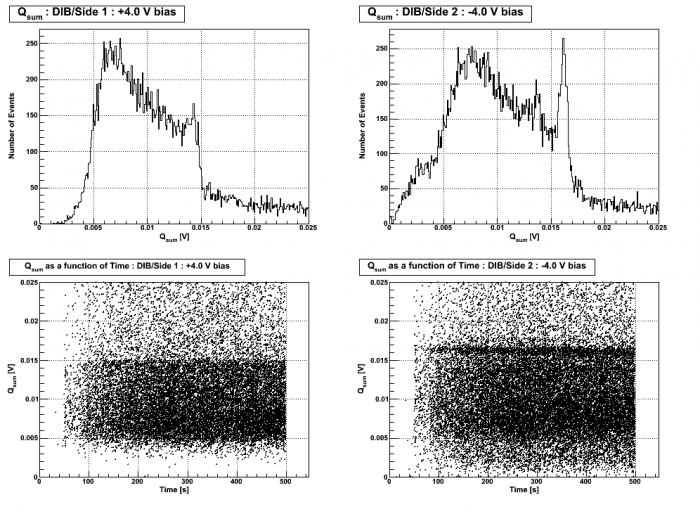
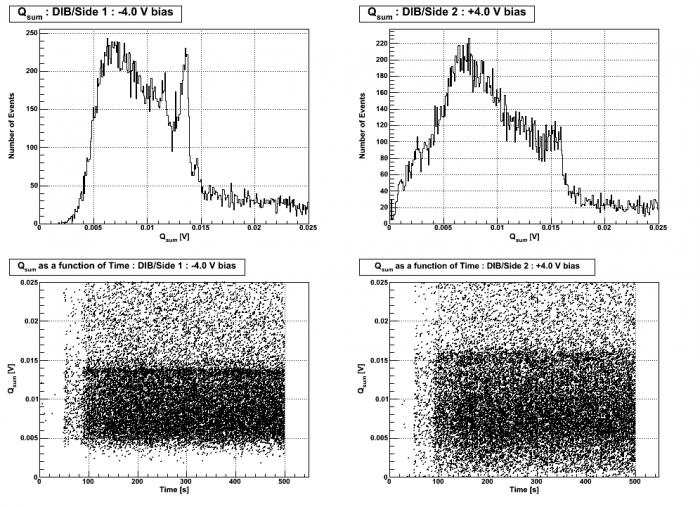
| Figure 6: Qsum (= Qi + Qo) Spectra and Qsum (= Qi + Qo) as a function of time after 500 seconds. | |
|---|---|
 |  |
| Figure 7: Qsum (= Qi + Qo) Spectra and Qsum (= Qi + Qo) as a function of time after 50 minutes. | |
|---|---|
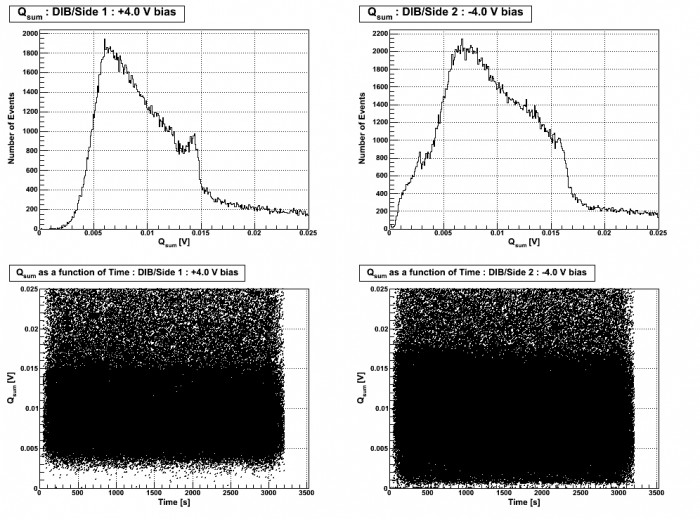 | 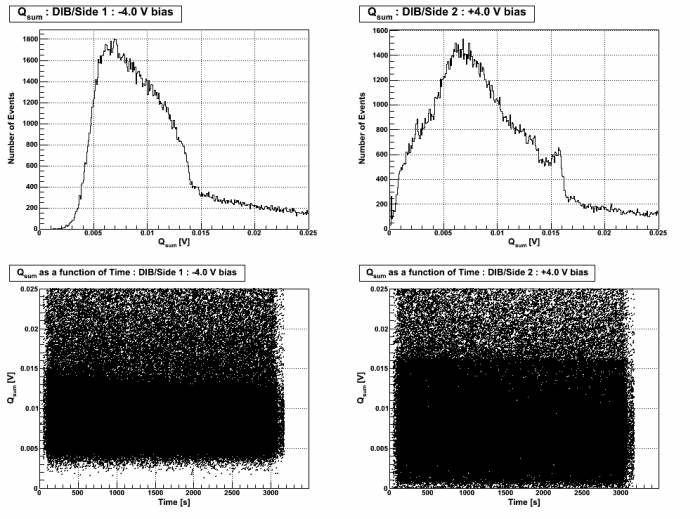 |
| Figure 8: Qsum (= Qi + Qo) spectra and Qsum (= Qi + Qo) as a function of time after 2 hours. | |
|---|---|
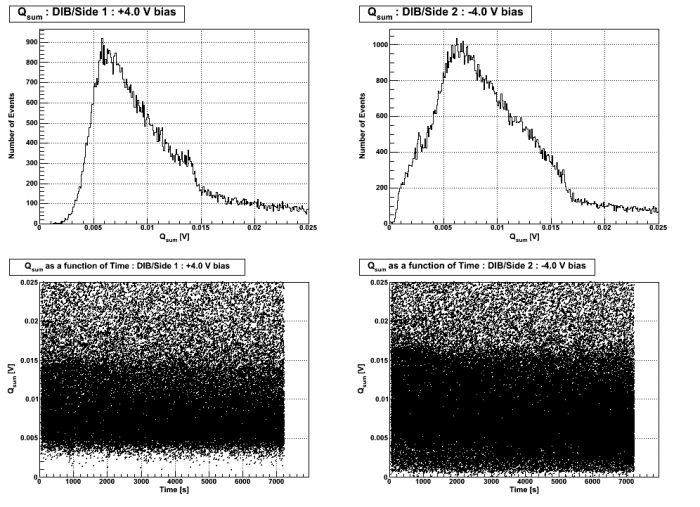 | 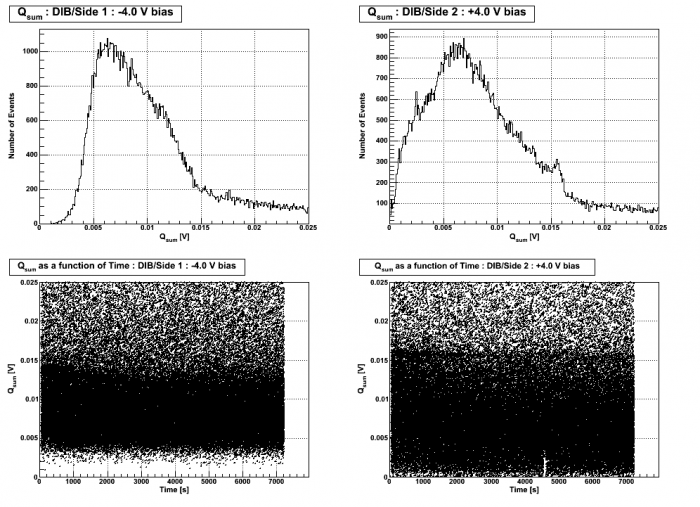 |
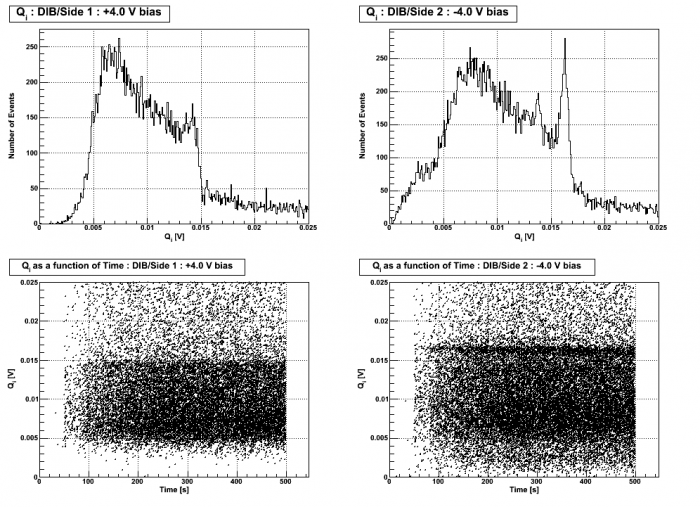
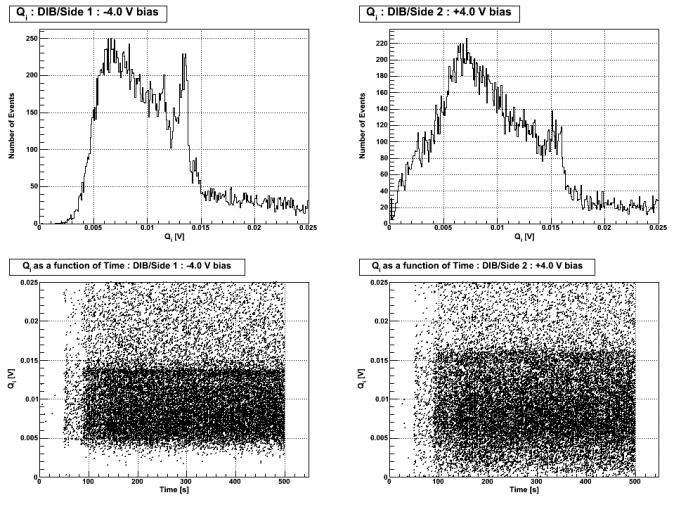
| Figure 9: Qi Spectra and Qi as a function of time after 500 seconds. | |
|---|---|
 |  |
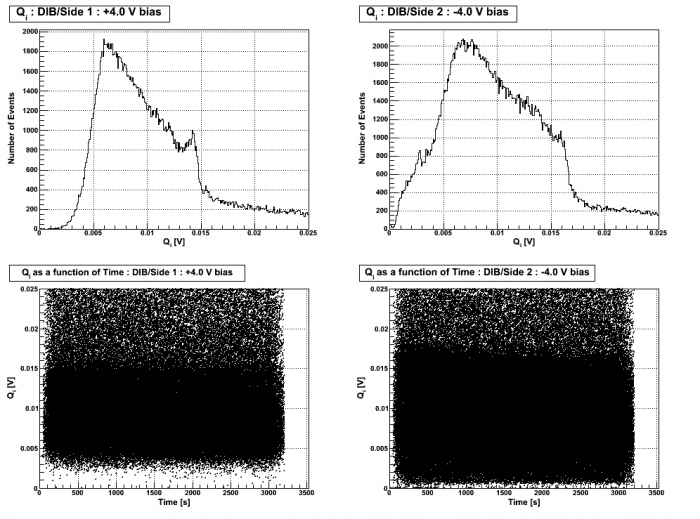
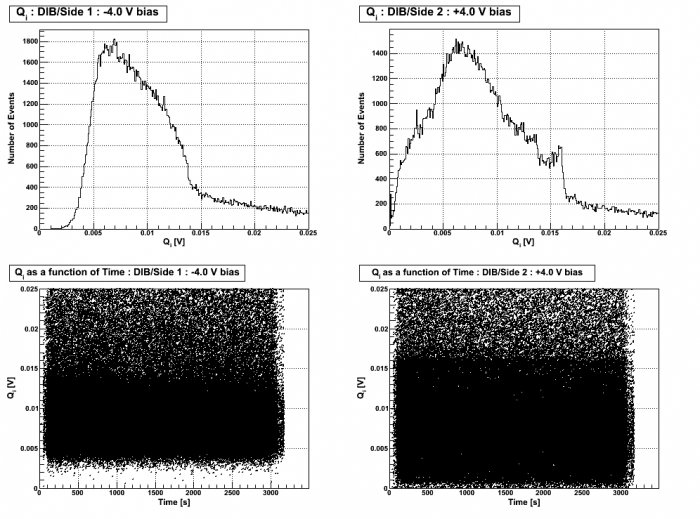
| Figure 10: Qi Spectra and Qi as a function of time after 50 minutes. | |
|---|---|
 |  |
| Figure 11: Qi Spectra and Qi as a function of time after 2 hours. | |
|---|---|
 |  |