Table of Contents
Run 23
Progress Report : DTC Meeting (10th February 2012)
Applying High Bias (>13 V / <-13 V) with External Power Supply
The maximum (minimum) uniform bias voltage that can be applied on with an unmodified DCRC board is 13 V (-13 V). The relevant register on the board is capable of being set at up to 14 V bias, but calibration differences between the boards translate to a practical range of -13 to +13 V. Although it is possible to unsolder a couple of resistors to sever the bias lines and attach an external power supply to increase the bias, the coupling capacitor in the side coax is expected to blow out at around 18 V.
The idea behind CDMSlite provides a possible solution to this problem. DIB1 phonon B, DIB2 phonon C & DIB2 phonon D are connected to the “ground” electrode. Rather than bias the charge electrodes, the connections between the phonon channels and DCRC boards can be severed and re-directed to an external power supply. By avoiding the coupling capacitor completely, we can effectively bias the boards at voltages greater than 18 V.
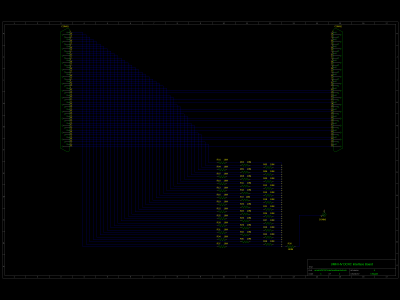
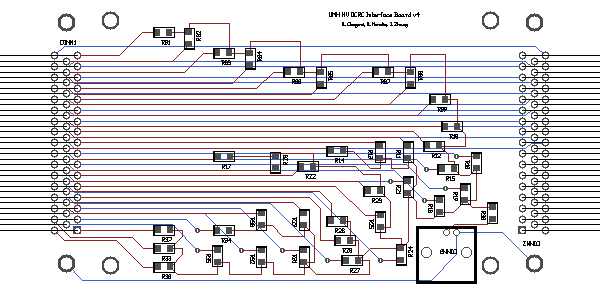
With a lot of help from Jeter and Sten, we've designed, manufactured and soldered components to the interface boards shown in Fig. 1. Each interface board sits between a DCRC and ebox connector, and diverts pins on the striplines associated with phonon channels away from the DCRC. An external power supply can be connected to these lines through a BNC connector. Resistors and the BNC connector have only been soldered on one of the interface boards. The other board's purpose is to sever the circuit, and hence no resistors are present.
| Figure 1: Circuit Diagram (left, click on picture for larger image) and PCB Outline (right) for “High” Voltage DCRC Interface Boards | |
|---|---|
 |  |
As shown in Fig. 2, plugging in the interface boards results in noise levels of the order of 400 mV peak-to-peak. This compares very poorly with that obtained with the DCRC boards (1-2 mV peak-to-peak, also shown in Fig. 2).
We managed to reduce the noise by an order of magnitude to around 40 mV peak-to-peak through shielding the interface boards with copper sheets and aluminium foil. Although the copper sheets did little to the noise, the aliminium foil was very effective. This was down to the ease with which the foil could be taped onto the DCRC shield and outside of the ebox. Grounding the boards to the ebox ground also led to a significant reduction in noise.
| Figure 2: Typical Traces when Interface Boards are Unshielded and Shielded. Waveforms witnessed when only the DCRC boards are connected are shown for Comparison. In all cases, y-axis is ADC bins (16 ADC bins = 1 mV) and x-axis is time in 800 ns bins. | |||
|---|---|---|---|
| Unshielded Interface Boards and DCRC | Interface and DCRC boards with Cludgy Shielding | DCRC boards only | |
| DCRC32 | 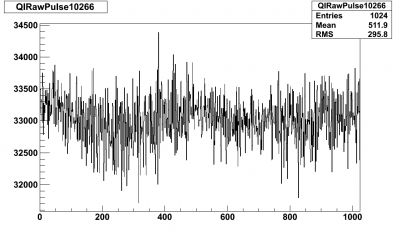 | 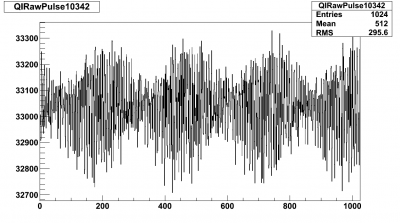 | 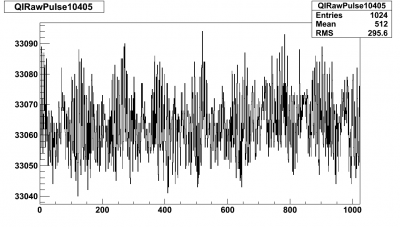 |
| DCRC32 | 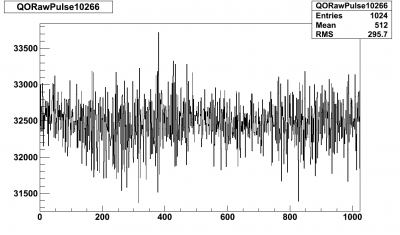 | 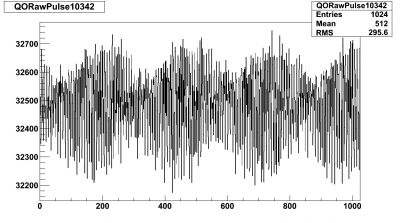 | 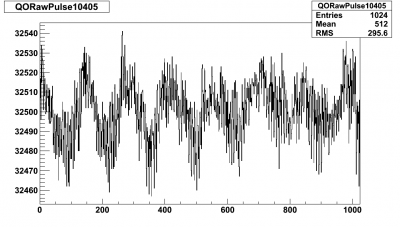 |
| DCRC33 | 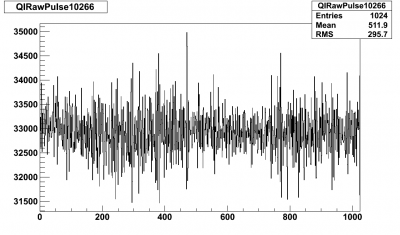 | 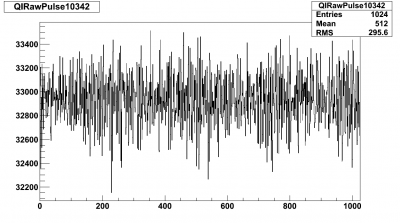 | 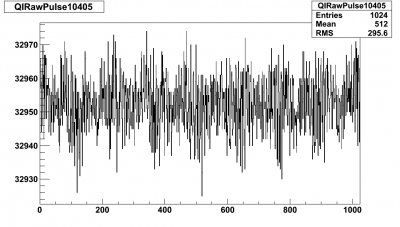 |
| DCRC33 | 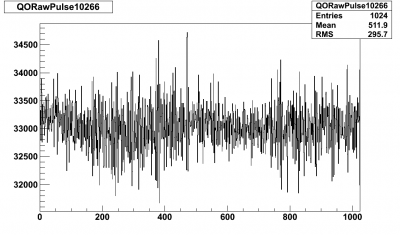 | 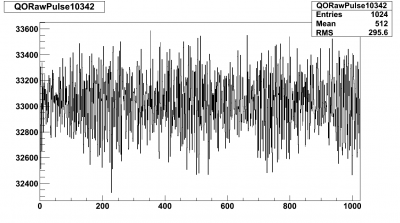 | 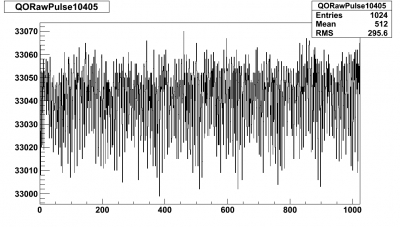 |
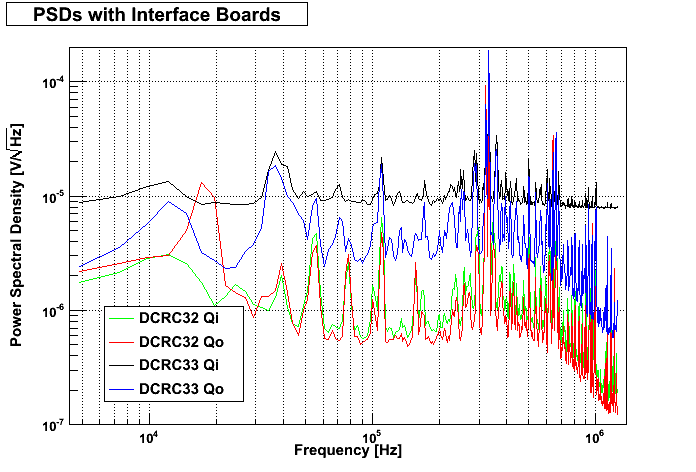
Unfortunately, even at 40 mV peak-to-peak, the noise level is too high to see the 356 keV peak from Ba-133 (nevermind the 60 keV peak from Am-241…). We need to reduce this by another factor of 10 before we can think about taking “high” voltage data. Sten has made a few suggestions, including the use of copper foil and establishing a more secure connection between the foil and ebox (screw-in the foil into a tapped hole on the ebox), and the foil and DCRC shield (solder the foil to the shield). A more secure box can also be fabricated to encase the interface board (mounting holes are present to facilitate this).
| Figure 3: Charge Noise PSDs with Shielded Interface Boards. |
|---|
 |
Early Analysis of Negative Bias Ba-133 Data
Data analyzed for Run 23 can be found here. To see the charge spectra at different voltage biases, click on "Voltage Biases" and select the bias of interest. Each bias set is organized according to date, and then by iteration/source. For example, on 2012/02/04 if -6V data was taken with only Am-241 and this was the third iteration of -6V data taken during the run, it would fall under 20120204/v3_am. For different voltage biases, the following analyses were done:
- Charge vs. time
- Charge chi2 vs. time
- Charge baseline stdv vs. time
- Charge vs. chi2 (First 15 min of data collection with primary channel cut)
- Charge spectra (First 15 min of data collection with primary channel cut and chi2 cut)
- Qsum (First 15 min of data collection with primary channel cut and chi2 cut)
| Figure 4: Qsum Spectra from Ba-133 Data Series at -2 V (left) and -3 V (right) Bias. There is a marked drop in charge collection efficiency between these two bias voltages. | |
|---|---|
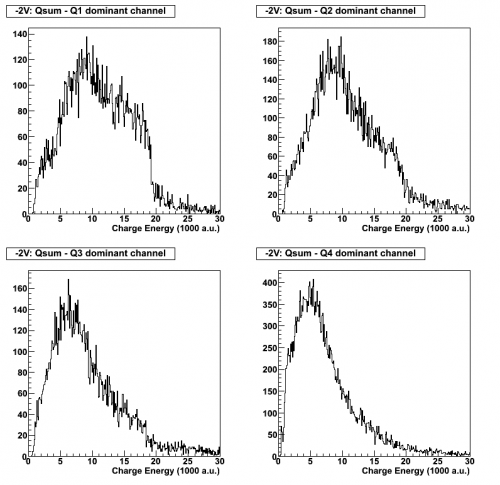 | 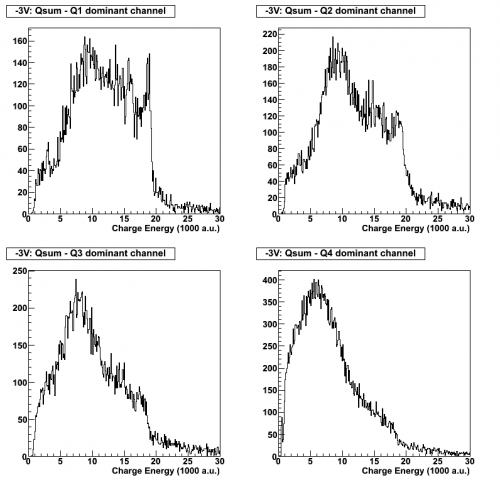 |
With reference to Fig. 4, the 356 keV peak is visible at -3 V bias when Q1 and Q2 dominate the signal. However, this does not hold true at -2 V, implying a marked drop in charge collection efficiency. Scaling those measurements performed with 1 cm crystals, we would expect to see full charge collection at -1.7 V bias. During Run 13, where an Am-241 source was placed above the centre of each electrode, we witnessed full charge collection at around -2 V. It is possible that bulk charge collection efficiency is simply worse.
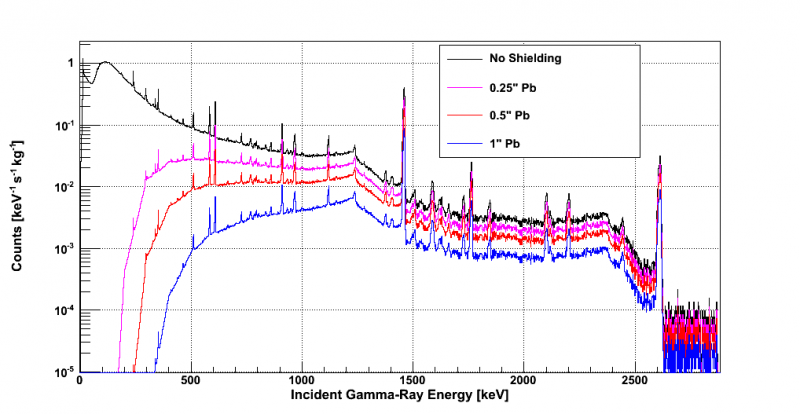
Having said that, it is difficult to determine the mean of the 356 keV peak at low biases (ie. 0 to -2 V.). The peak seems to merge with our background, which hampers its resolution. Although it would require another run, and G102a should be sent to SLAC for repolishing soon, our plans for a lead shield would help to significantly reduce the flux of incident photons in this energy region, and may therefore result in a clearer peak.
Lead Shield
| Figure 5: Event Rate as a Function of Photon Energy for Different Thicknesses of Lead Shielding. |
|---|
 |
Progress Report : DMC Meeting (17th February 2012)
In the initial progress report (2012/02/10) we discussed the motivations and development of high voltage interface boards to be placed between the DCRCs and the ebox. When referring to “high voltage”, we mean that we wish to scale up the voltage applied to the crystal from the usual 0-10V range to ~ 200V. This past week we put these boards into practice. However, we encountered several issues with noise peaks in the PSD's that necessitated debugging. There were also problems with the application of voltage > 15V to the crystal (i.e. charge breakdown). These issues and the steps to correct them will be discussed in detail below. Also, an overview of acceptable data collected and analyzed are listed in this update.
Noise De-bugging
Before actually taking data with the HV interface boards, we wanted to reduce the peak-to-peak noise the DCRC-HV board coupling to the ebox introduced. Also, there were several unhelpfully dominant spikes in the PSD plot that we aimed to get ride of.
Tests
1- DCRC33 with one HV board shieled by Al box
From previous testing with the interface boards we knew that placing some shielding around the boards with aluminum foil would reduce the noise a little bit, but not significantly. Due to the flexible nature of foil, the noise signal was not consistent. We decided to build an aluminum box to surround the HV board to provide a more solid shield. Once the shielded HV board was connected with the DCRC33 and additional shielding of copper tape around the connections were put in place, we found that the peak-to-peak (P-P) noise fluctuated greatly with slight movement of the boards. This caused us to suspect that the connection between the DCRC and HV board or the HV board and the ebox were not very good - the next test would require these connections to confirmed secure. Amidst the fluctuations, however, a P-P value of 3 mV was observed, so we knew that we could reduce our noise significantly lower than 20 mV. In this test, we also found that two of the mounting holes on the interface board weren't connected. However, when we did bench tests on the interface boards to check continuity, they passed (and the board design shows that this should be the case). The reason for the short is believed to be due to stress created on the connectors when the DCRC and the interface boards are attached, which makes a poor connection.
2 - Improved grounding and connections
In response to test 1,we soldered a wire between the two connectors and another wire from one of the connectors to the aluminum shield to ensure sufficient connection and improve grounding. Re-installing the DCRC33 with the same HV board with this improved scheme, we obtained the following noise & PSD plots for Qi:
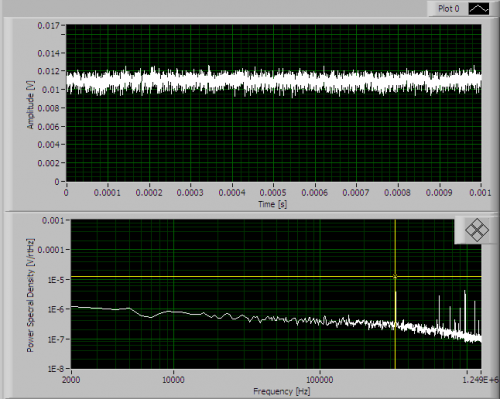
The corresponding Qo plot can be found in the run diary.
This noise was consistent and appropriate for data-taking - intermediate success!
3 - DCRC33 and DCRC32 with both HV boards - DCRC33 off
- 3A - DCRC32 on, DCRC33 off
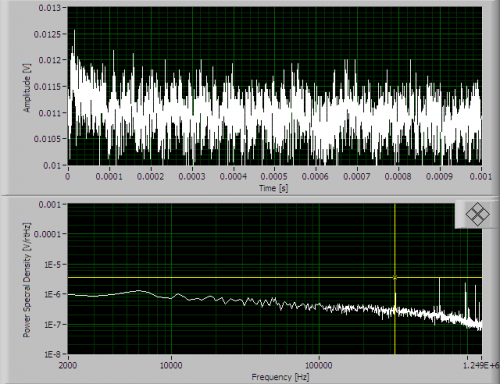
The next step we made was to put both HV boards in place with shielding. Instead of making another aluminum box, we used a copper foil sheet to surround the second HV board. Using the copper tape again as additional shielding and support, we noted the following for the noise and PSD with DCRC32 powered and DCRC33 off:
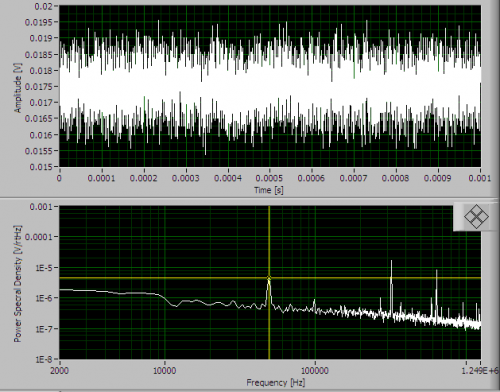
The P-P noise is still about 3 mV with both boards in place, but we see a large frequency peak at ~ 49 kHz.
- 3B - DCRC32 on, DCRC33 off
DCRC32 was turned off and DCRC33 was powered on. The P-P noise jumped to 15 mV and 20 mV for Qi and Qo, respectively.
Grounding was still a strong suspect, and we noted that slight movement of DCRC33 produced noise fluctuations.
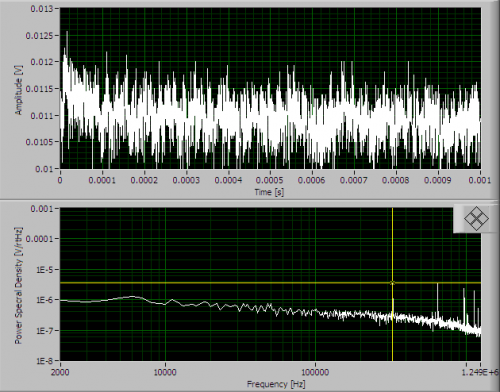
- 3C - DCRC32 on, DCRC33 off
In our tests looking at different grounding connections, it appeared that the more grounding connections between the ebox and the digital ground that were made (using wires with alligator clips), the more the noise decreased (though slightly). Hence our suspicion of the digital ground. Thus, a “permanent” solution was made by soldering a wire on the digital ground of DCRC32 to the shield of its interface board, which is sufficiently grounded to the ebox.This reduced Qi and Qo to 7 mV P-P each.
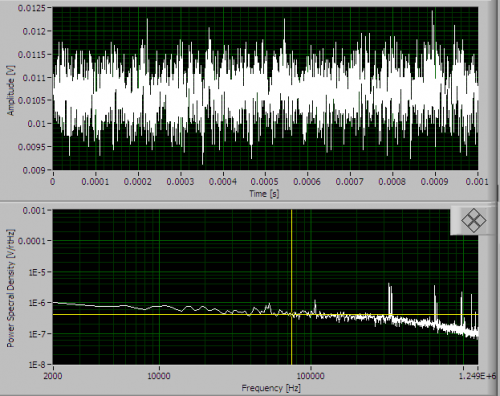
4 - DCRC33 and DCRC32 with both HV boards - both DCRCs on
With the improvements of Test 3C, we powered on both DCRC boards. This introduced several new peaks in the PSD:
5 - Both DCRCs on with HV boards - final shielding/grounding modifications
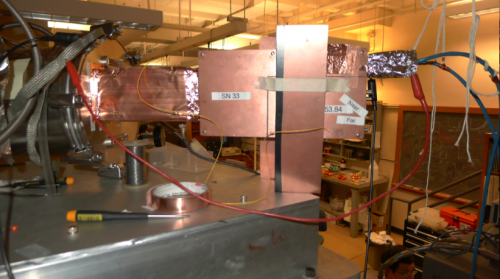
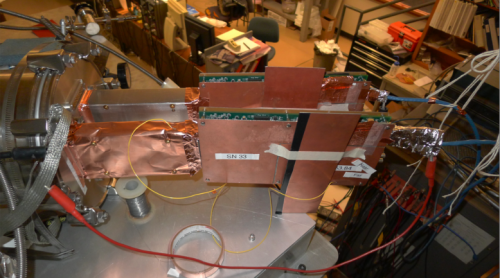
After several variations of shield the Cat6 cable and grounding of the Cat6 cable shield, we obtained a configuration that removed two noticeable frequency peaks. The PSD has cleaned up quite nicely and doesn't show the small peaks somewhat present through the tests, situated between 10-20 kHz. This was the last configuration change in terms of grounding and shielding for this DCRC-HV board testing. The configuration can be seen below:
After attaching the BNC cable to the interface board, we took a final noise/PSD plot combination:
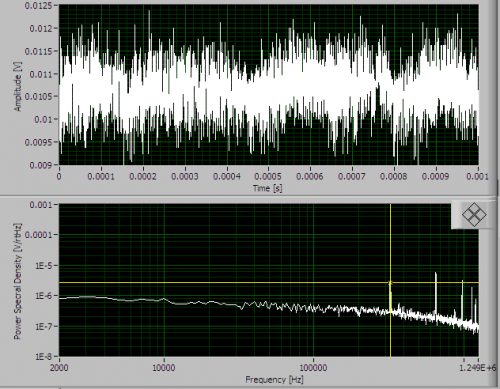
Though we were able to get rid of several pesky noise peaks in the PSD, we are still confronted with the issue that having both coupled boards plugged in increases the P-P noise. We have not been able to get down to the consistent 2 mV P-P noise we saw with only one HV board and DCRC33.
Table to summarize tests and noise peaks
| Test | Peak-to-Peak (mV) | Peaks in PSD (Hz) |
|---|---|---|
| 1 | 3 | |
| 2 | 2 | 10-20 kHz |
| 3a | 3 | 49 |
| 3b | 15-20 | 10-20 (small) |
| 3c | 7 | 10-20 (small) |
| 4 | 3-4 | 10-20 (small), 55, 106 kHz |
High Voltage Tests
In the initial progress report (2012/02/10) we discussed motivations and development of “high” voltage interface boards to be placed between the DCRCs and the ebox. This past week we put these boards into practice. When presented with consistently low and clean noise levels, we could apply voltages via the interface boards and take data to see how the crystal responded. We found two issues in these tests: 1) very noisy charge baselines; 2) with higher biases the fridge temperature rose.
1) The first data set was taken in Test 1. With 2 mV P-P and a relatively clean PSD, we had ideal conditions to apply bias via the boards and get pulses. Note that only one board was in place and, therefore, we will only see signals in Q1 and Q3.
| +10V applied to the back of the crystal; Ba-133; Q1, Q3 only |
|---|
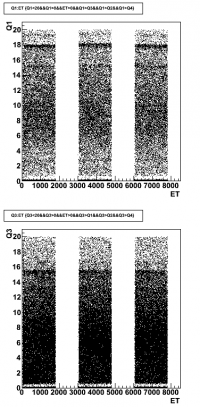 | 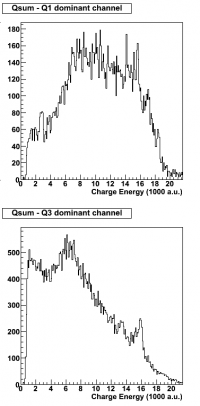 |
The spectrum reflects the first 15 minutes of data taking and has chi2 and primary channel cuts applied.
After inserting both boards and completing the noise de-bugging process, we again applied +10V to the back of the crystal.
| +10V applied to the back of the crystal; Ba-133; Q1-Q4 |
|---|
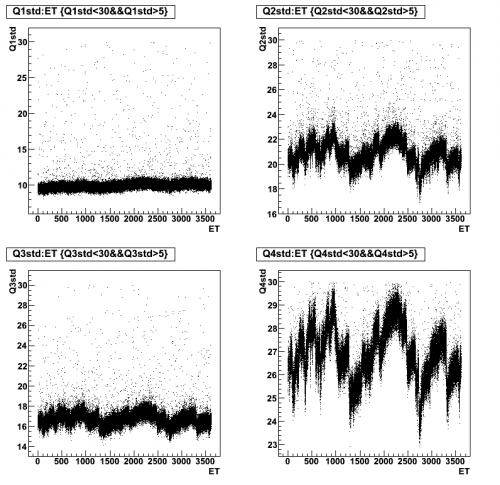 |  |
Clearly, we are being dealt with very unstable noise. We can compare the charge baseline here to data taken in Run 22 with -10V bias and a Ba-133 source:
| -10V; Ba-133; Q1-Q4 only |
|---|

2) With an external bias of 10V applied to the crystal, we had acceptable data taking conditions. However, at higher biases of 15V and 20V the fridge temperature rose and at 20V we would see changes in the baseline. Below is a brief table summary on the temperature increase.
| External Bias | Comment on Temp/Qstd |
|---|---|
| +15V | Jump to 86.8 mK from 81.4 mK |
| +15V | Jump to 81.7 mK from 78 mK |
| +20V | Spiked quickly and variation in baseline - didn't wait long enough to see what it could reach |
Final Update of R23 for DTC Meeting 2012/03/01
To become aware of what happened in the earlier parts of Run 23 in regards to the higher bias tests and noise-debugging, please refer to the previous updates. This final update will briefly summarize the comprehensive data taken and the final high voltage tests conducted with G102a.
"High" Voltage Tests
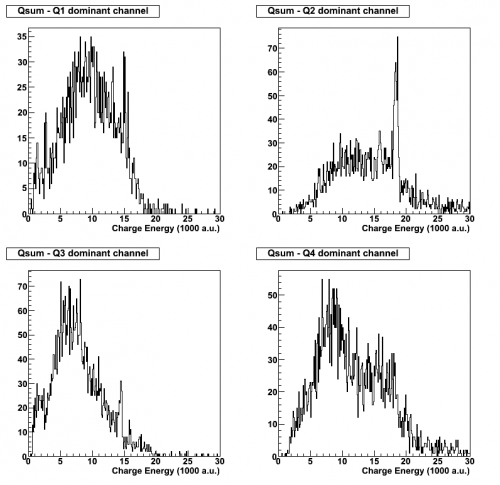
Previous attempts to apply voltages greater than the standard limit of +/- 13 V appeared unsuccessful in that it seemed we could not apply more than +10 V to the back of the crystal before experiencing charge break down and rapid temperature increase. However, in reversing the polarity of the applied bias we found that we could apply up to -35V to the back of the crystal before experiencing the above-mentioned effects. We took two data sets with this bias- one at base temperature and one at 400 mK. Unfortunately, the set at base temperature was of poor quality. The data taken at 400 mK are shown below.
| -35 V applied to the back of the crystal ; Ba-133 & Am-241 ; 400 mK |
|---|
| Cuts applied: Chi2, primary channel, and low energy cut-off |
 |  |

The peaks in the spectra with Q1, Q2, and Q3 dominanace are wonderfully clear. In the individual charge spectra, the peak is not apparent in Q3 and Q4.
Data Summary
To see preliminary analyses for Run 23, you can go here.
For different voltage biases, the analyses included (but were not limited to) the following:
- Charge vs. time
- Charge chi2 vs. time
- Charge baseline stdv vs. time
- Charge vs. chi2
- Charge spectra and Qsum
Base Temperature
Sources: Ba-133 & Am-241
| Bias | Bias |
|---|---|
| -1V Ba-133 & Am-241 | +1V Ba-133 & Am-241 |
| -2V Ba-133 & Am-241 | +2V Ba-133 & Am-241 |
| -3V Ba-133 & Am-241 | +3V Ba-133 & Am-241 |
| -4V Ba-133 & Am-241 | +4V Ba-133 & Am-241 |
| -5V Ba-133 & Am-241 | +5V Ba-133 & Am-241 |
| -6V Ba-133 & Am-241 | +6V Ba-133 & Am-241 |
| -7V Ba-133 & Am-241 | +7V Ba-133 & Am-241 |
| -8V Ba-133 & Am-241 | +8V Ba-133 & Am-241 |
| -9V Ba-133 & Am-241 | +9V Ba-133 & Am-241 |
| -10V Ba-133 & Am-241 | +10V Ba-133 & Am-241 |
Sources: Am-241
| Bias | Bias |
|---|---|
| 0V Am-241 | |
| -5V Am-241 | +5V Am-241 |
| -7V Am-241 | +7V Am-241 |
| -10V Am-241 | +10V Am-241 |
For data at higher temperatures, analyses are not complete. Quality hasn't been fully determined.
At 200 mK
Sources: Ba-133 & Am-241
| Bias | Bias |
|---|---|
| -2V Ba-133 & Am-241 | +2V Ba-133 & Am-241 |
| -4V Ba-133 & Am-241 | +4V Ba-133 & Am-241 |
| -6V Ba-133 & Am-241 | +6V Ba-133 & Am-241 |
| -8V Ba-133 & Am-241 | +8V Ba-133 & Am-241 |
| -10V Ba-133 & Am-241 | +10V Ba-133 & Am-241 |
At 400 mK
Sources: Ba-133 & Am-241
| Bias | Bias |
|---|---|
| -2V Ba-133 & Am-241 | +2V Ba-133 & Am-241 |
| -4V Ba-133 & Am-241 | +4V Ba-133 & Am-241 |
| -6V Ba-133 & Am-241 | +6V Ba-133 & Am-241 |
| -8V Ba-133 & Am-241 | +8V Ba-133 & Am-241 |
| -10V Ba-133 & Am-241 | +10V Ba-133 & Am-241 |
At 600 mK
Sources: Am-241
| Bias |
|---|
| -10V Ba-133 & Am-241 |
At 2 K
Sources: Ba-133 & Am-241
| Bias | Bias |
|---|---|
| -6V Ba-133 & Am-241 | |
| -8V Ba-133 & Am-241 | +8V Ba-133 & Am-241 |
| -10V Ba-133 & Am-241 | +10V Ba-133 & Am-241 |
Sources: Am-241
| Bias | Bias |
|---|---|
| -8V Am-241 | |
| -10V Am-241 | +10V Am-241 |
"High" Voltage
A good quality set!
| Bias |
|---|
| +35V Ba-133 & Am-241 @ 400 mK |