Table of Contents
Run 17
Summary
Setup
| Table 1: Run 17 setup | ||
|---|---|---|
| Detector | G53 | |
| Tower | T1 | |
| DIB | 1 | 2 |
| Face | 2 | 5 |
| Side coax | ZB1-1-6 | ZB1-1-9 |
| SQUET | ZC23 | ZC70 |
| Stripline | #19 | #20 |
| Readout | DCRCv3 | |
DAQ Issues
“Not enough memory” error frequently occurs. Determined this was due to reset of connection to DCRC30 (slave board). The connection would reset at seemingly random intervals. Error was traced back to problem with port to DCRC33 (master board). Changing port solved the issue.
Possible Problem with LEDs
Although the LEDs passed detector level continuity checks (see iZIP Detector History entry 464 & run diary page: 2011/09/08), some unusual behaviour was witnessed when monitoring the tower temperature. When flashing all LEDs (current 0.6 mA, flash-on time 100 μs, flash-off time 5 ms), the tower temperature rose to 140 mK. This is significantly lower than the typical temperature of 400-500 mK. Checking the pulses on the oscilloscope showed no signs of any problems.
It is unknown if this is a problem with the DAQ software/hardware or the LEDs themselves. The next run with G51 should provide an answer.
Tc Measurement
| Table 2: G53 Critical Temperatures | |
|---|---|
| Channel | Temperature [mK] |
| PAS1 | 70 |
| PBS1 | 79 |
| PCS1 | 77 |
| PDS1 | 78 |
| PAS2 | 93 |
| PBS2 | 85 |
| PCS2 | 86 |
| PDS2 | 85 |
Measured critical temperatures for all eight phonon channels are shown in Table 2. Power was applied to the mixing chamber heater to increase the tower temperature. Once the tower temperature stabilised at 100 mK, the mixing chamber heater was switched off and the output of a triangle wave from each phonon channel was observed for changes as the tower cooled. Upon entering the transition region, the triangle wave would become distorted, thus indicating the critical temperature.
Charge Stability Measurements
-2.5 V Side 1 & +2.5 V Side 2
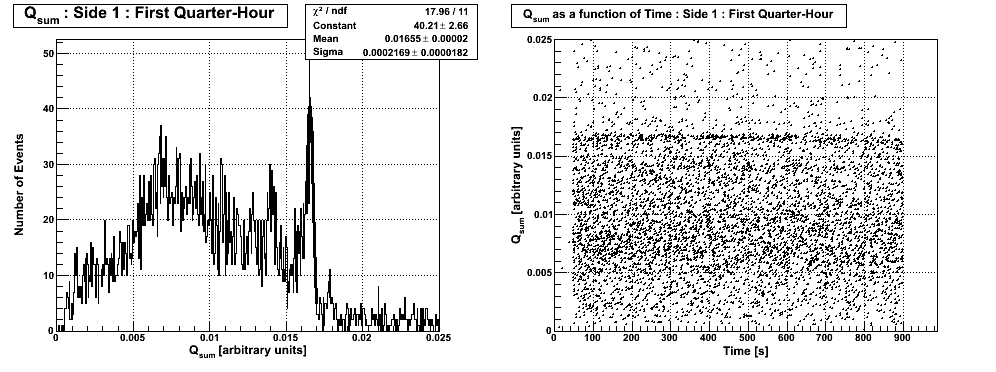
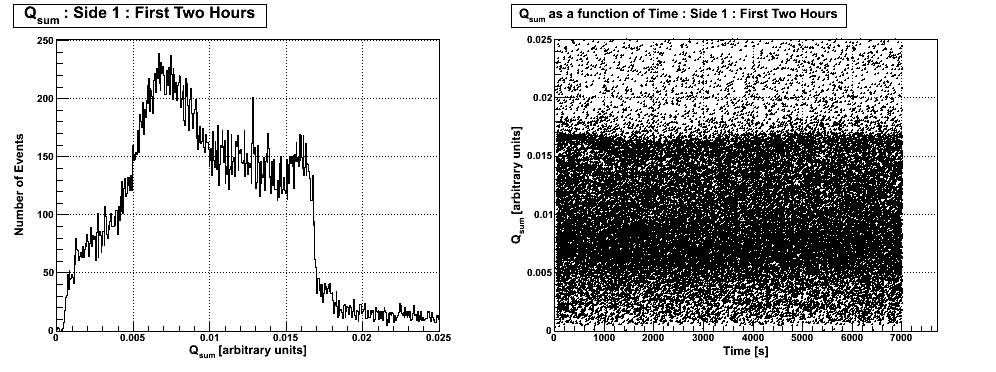
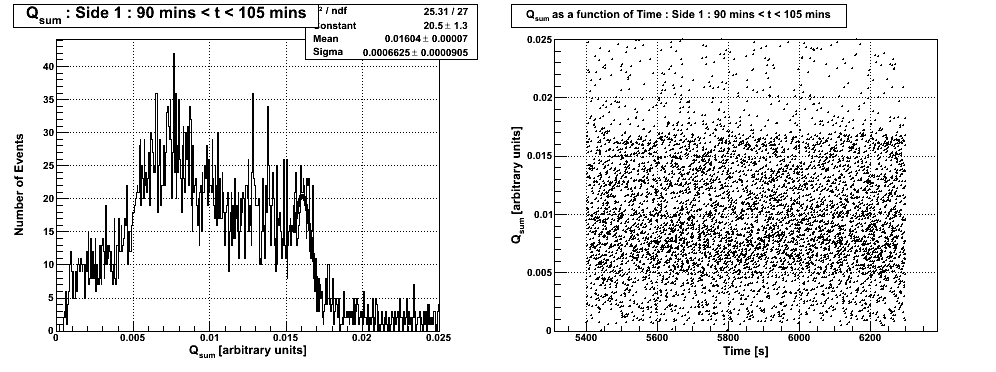
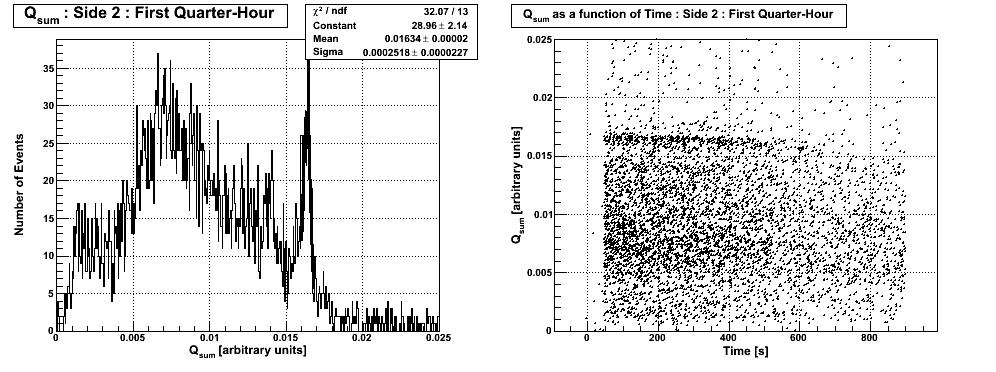
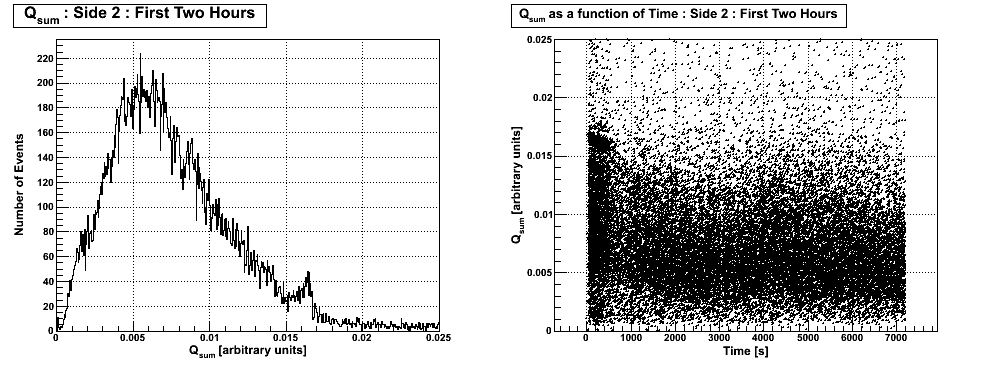
The evolution of Qsum from short trace length (0.4096 ms) data series indicates that neutralisation is lost after 15 minutes. The detector exhibits very good energy resolution evidenced by the 356 keV peak in the first 15 minutes. A strange feature in the Qsum evolution plot over two hours is the apparent restoration of charge stability after 60 minutes. It is unclear why this feature appears, but taking a 15-minute slice during this period indicates that there is no improvement in neutralisation.
| Figure 1: Qsum & Qsum as a function of time from data series 07110913_1912. |
|---|
 |
 |
 |
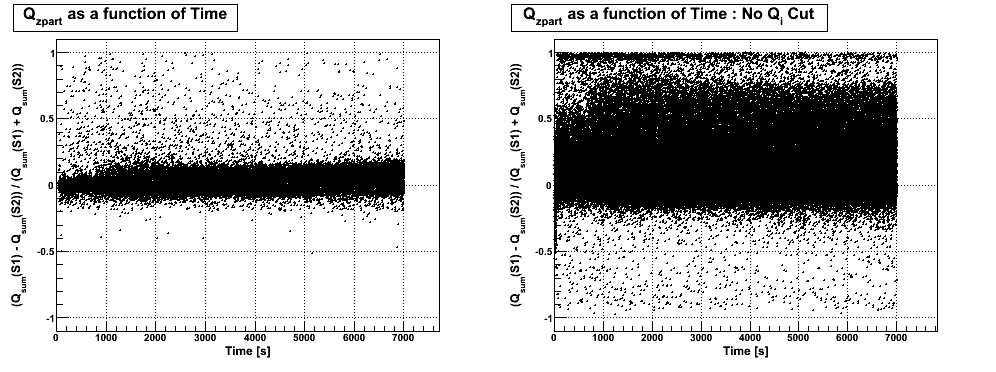
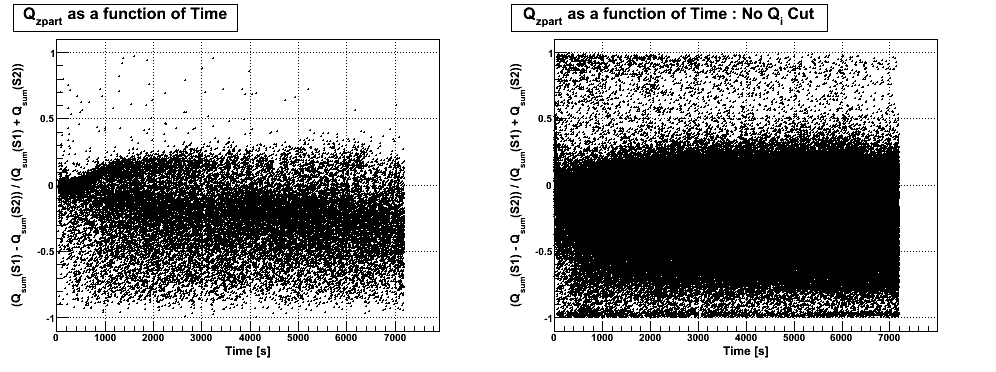
The evolution of Qzpart in Fig. 2 is similar to a funnel for the first 15 minutes. This stabilises for the remainder of the data set.
| Figure 2: Qzpart as a function of time from data series 07110913_1912. |
|---|
 |
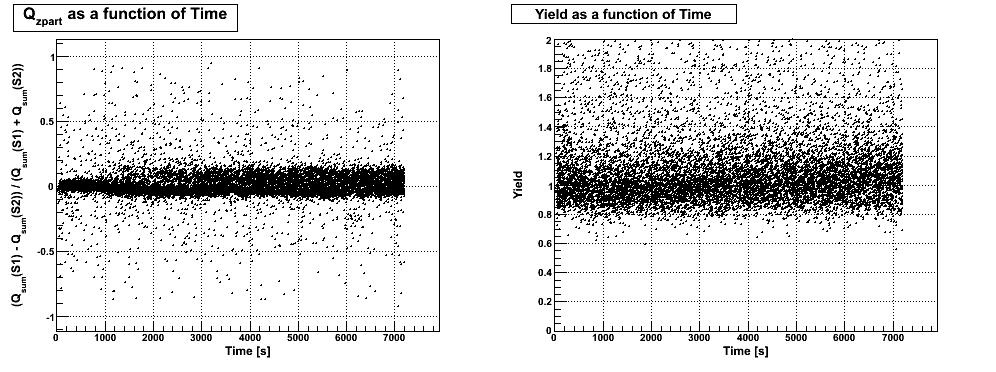
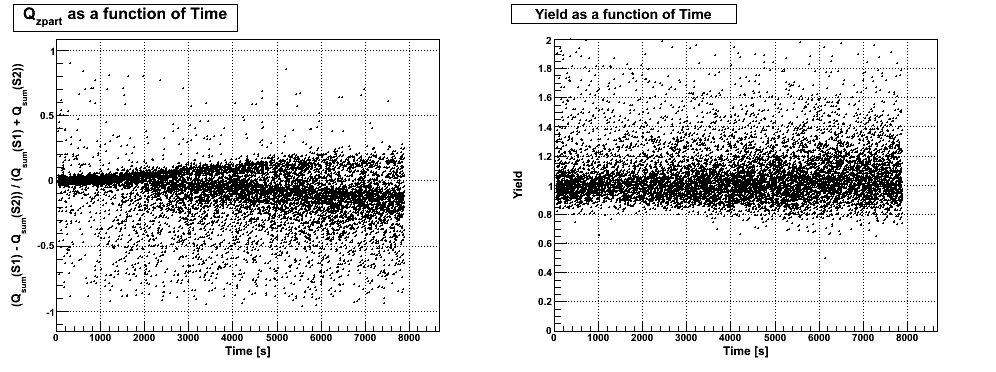
Qzpart from data series with longer trace lengths (3.2768 ms) to incorporate the phonon signals (Fig. 3) is in good agreement with that shown in Fig. 2. The yield does not appear to degrade at all.
| Figure 3: Qzpart & Yield as a function of time from data series 07110915_1916. |
|---|
 |
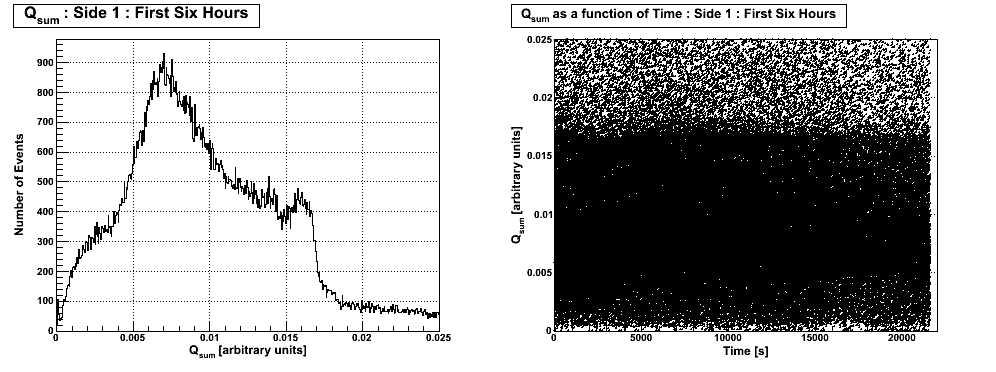
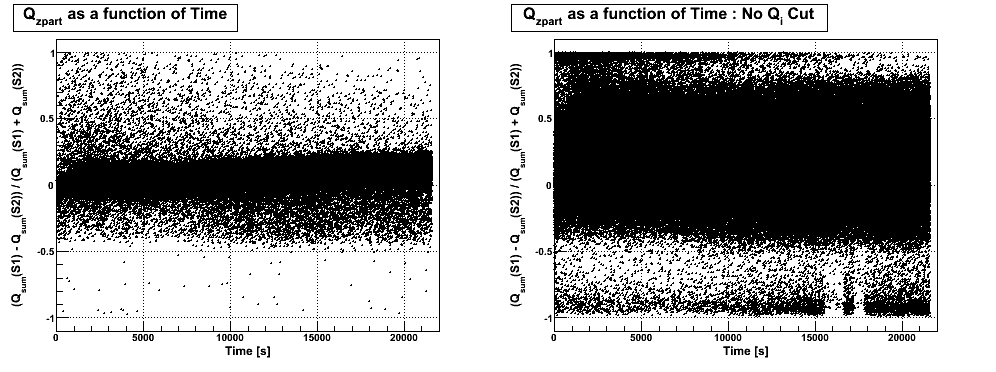
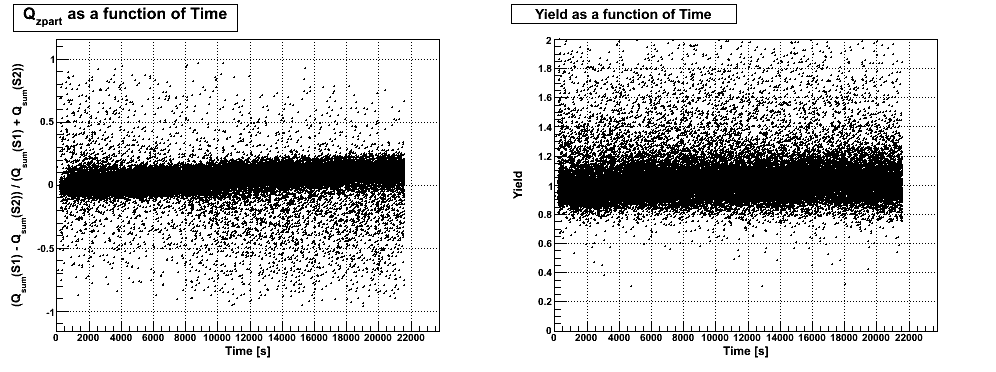
Longer 6-hour data series were taken to observe the apparent restoration of neutralisation after 60 minutes, and the evolution of yield with time to search for some evidence of degredation. The results are shown in Fig. 4, 5 & 6.
In Fig. 4 it appears that any restoration in neutralisation is short-lived. However, encouragingly, even after 6 hours under bias, the 356 keV peak is visible in the Qsum spectrum, albeit with a lower energy resolution.
| Figure 4: Qsum & Qsum as a function of time from data series 07110917_1039. |
|---|
 |
With reference to Fig. 5, Qzpart tends toward Side 1 (negative bias) after approximately 2 hours. This is consistent with what is seen in the longer trace length (3.2768 ms) data series in Fig. 6. Again, no degredation in yield is seen even after 6 hours under bias.
| Figure 5: Qzpart as a function of time from data series 07110917_1039. |
|---|
 |
| Figure 6: Qzpart & Yield as functions of time from data series 07110916_2109. |
|---|
 |
+2.5 V Side 1 & -2.5 V Side 2
Neutralisation appears to degrade faster when Side 1 is under positive bias. The Qsum evolution plots in Fig. 7 indicate that Qsum degrades just shy of 10 minutes under bias. Having said that, the 356 keV peak is still visible, albeit barely, after 2 hours.
| Figure 7: Qsum & Qsum as a function of time from data series 07110914_2149. |
|---|
 |
 |
Comparing the evolution of Qzpart in Fig. 8 to that when Side 1 is under negative bias in Fig. 2, the width of the funnel increases for the length of the 2-hour run, dividing into two separate populations after around 15 minutes under bias.
| Figure 8: Qzpart as a function of time from data series 07110914_2159. |
|---|
 |
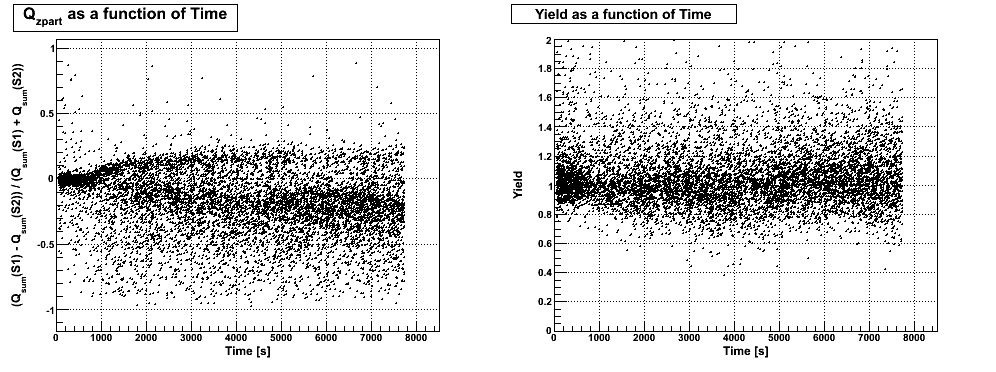
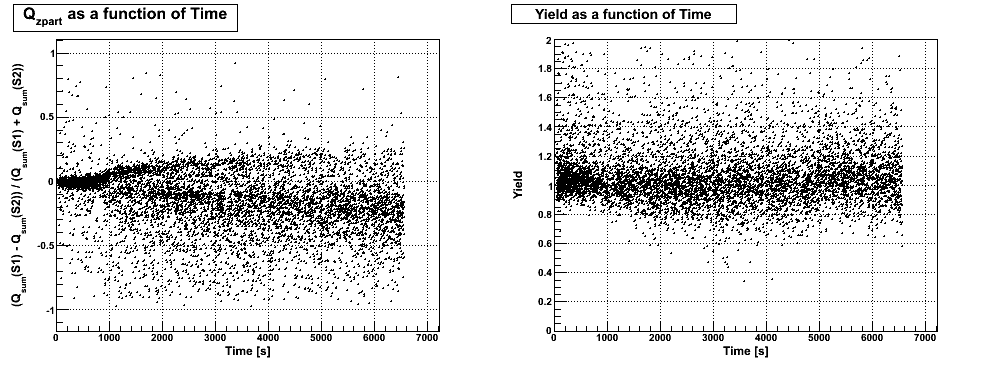
These two populations are more evident in Fig. 9(a). Interestingly, eveolutions of Qzpart in Fig. 9(b) & 9© appear to be different than that seen in Fig. 9(a). Fig. 9(b) & 9© exhibit a behaviour more in line with what is seen in Fig. 8.
One possible reason for this is that the detector was flashed for 20 minutes prior to the data set in Fig. 9(a). Then the detector was flashed for 10 seconds before the data sets in Fig. 9(b) & 9© were collected. It is possible that, due to the LED problem described above, the detector was not properly neutralised during these short flashes.
This begs the question as to why this behaviour isn't seen in data taken when Side 1 was under negative bias. It appears that neutralisation degrades to a far greater degree when Side 1 is under positive bias. Therefore, a short flash might have been enough to restore neutralisation when Side 1 is under negative bias, but may not have been sufficient to counteract the greater enutralisation loss when the bias is flipped.
| Figure 9: Qzpart & Yield as functions of time. |
|---|
| (a) Data series 07110916_0221. |
 |
| (b) Data series 07110916_0453. |
 |
| (c ) Data series 07110916_0722. |
 |
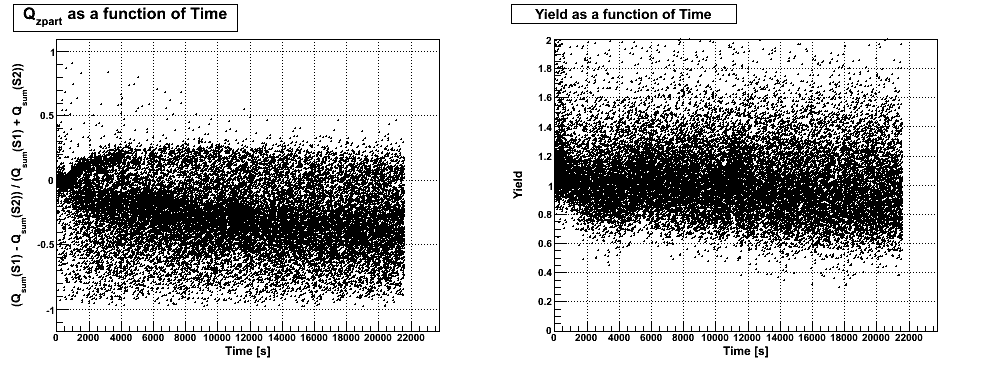
The evolution of Qzpart and Yield from a longer 6-hour data series are shown in Fig. 10. Yield appears to degrade gradually with a starting point that is difficult to discern. There appears to be a very small drift of Qzpart towards Side 2 at greater times.
| Figure 10: Qzpart & Yield as functions of time for data series 07110917_0354. |
|---|
 |