Table of Contents
Run 16
Summary
Setup
| Table 1: Run 16 setup | ||
|---|---|---|
| Detector | G102 | |
| Tower | T1 | |
| DIB | 1 | 2 |
| Face | 2 | 5 |
| Side coax | ZB1-4-6 | ZB1-4-8 |
| SQUET | ZC23 | ZC70 |
| Stripline | #19 | #20 |
| Readout | DCRCv3 | |
One Am-241 source faces the ground electrode below Q2.
Cryogenic Problems
While blowing out liquid nitrogen from the main bath during cooldown, half-a-litre of oil from the 1 K pot pump leaked past the filter into the exhaust. The run was interrupted to facilitate draining the oil and cleaning the piping. It is likely that the pressure of helium gas used to blow out the nitrogen was too high and pushed the oil out. Although the helium pressure was lower than the manufacturer's maximum value, the age of the pump should be taken into consideration.
One possible solution to avoid this in future is to intall a speedivalve between the IGH and 1 K pot pump. This speedivalve could be shut while blowing out, severing any connection between the helium gas and pump.
Due to the exhaust leading to the helium recovery system, the pipes had to be throughly cleaned. The possibility of bleeding helium from the 1 K pot into the atmosphere rather than recovery system has been raised, as a relatively small amount of helium is collected this way compared with boil-off. However, releasing helium into the atmosphere might have an effect on the background helium leak rate, and could potentially affect a leak test in Little Blue.
DAQ Problems
The data acquisition rate slows down in the middle of runs for reasons we are unsure of. When this occurs, the DAQ mistriggers and we collect junk. This is a problem that we have encountered in the past. Increasing the trace length, and hence the time between triggers, seems to solve it. However, the reasons for this behaviour should be investigated.
Ge Tower Meeting (2 September 2011)
Uniform bias of -4 V
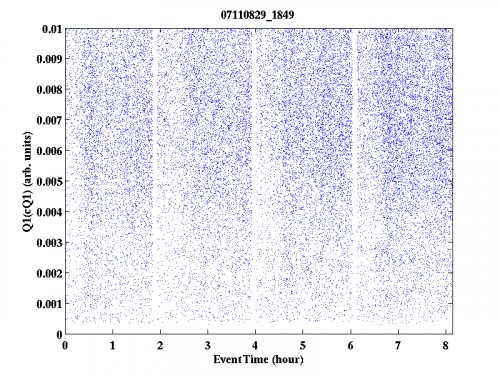
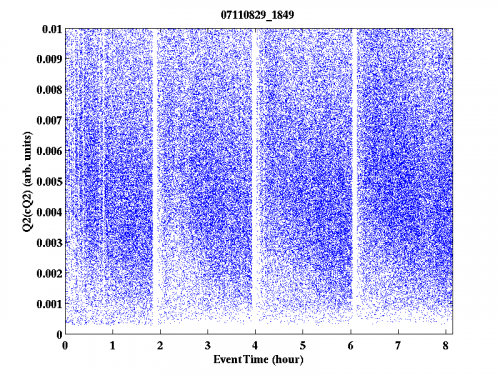
Our first data set is taken applying a uniform bias of -4 V across all electrodes. Plots of Qn (n = 1,2,3,4) as a function of time are shown in Fig. 1 (a complete set of plots can be found here). A maximum signal cut has been applied such that each Qn plot only shows events where the signal in Qn is greatest.
| Figure 1: Qn (n = 1,2,3,4) as a function of time at uniform bias voltage -4 V. Each plot only features events with the largest signal in their respective channel. | |
|---|---|
 |  |
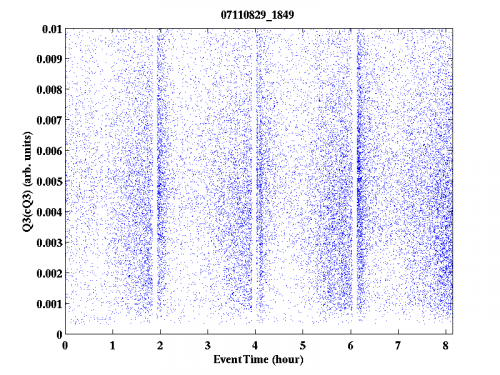 | 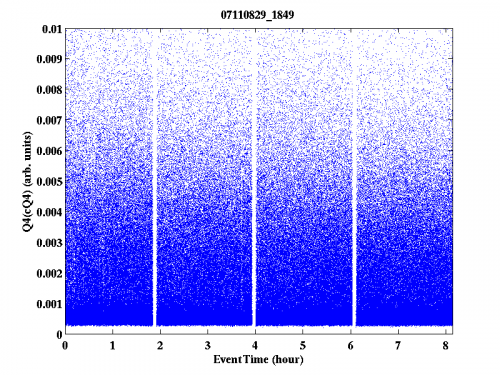 |
As discussed above, the data acquisition rate slows down in the middle of runs, as evidenced by the vertical white lines in the first data series. This problem is clearly evident in our second data set taken at +4 V, the plots for which can be found here.
Additionally, the 60 keV line is not visible. Looking at Fig. 1, it is clear that most of the events deposit most of their energy in Q2 & Q4. This is understandable as the source is located under Q2 (albeit with 3.3 cm of germanium in between) and Q4 lies on the outer edge.
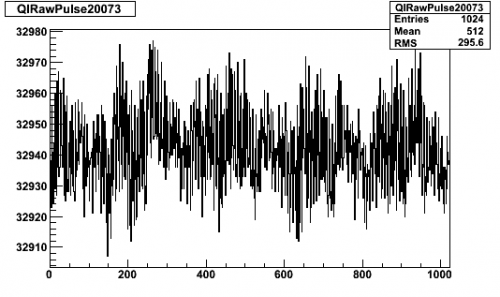
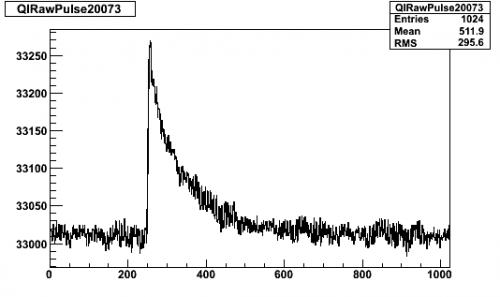
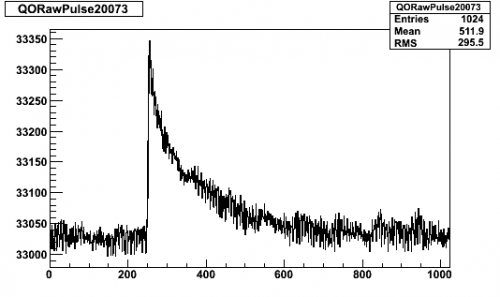
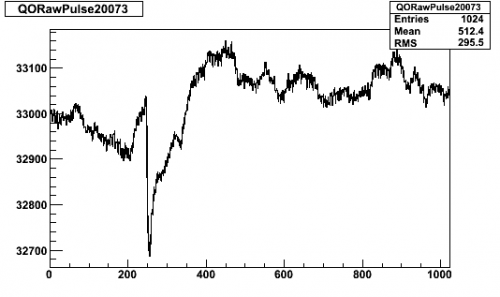
When looking at individual pulses, some strange behaviour is witnessed in Q4, namely a very erratic baseline and negative pulses. A typical example is shown in Fig. 2. Bearing in mind that Q4 should have been biased at -4 V, and hence should collect holes (ie. positive pulses), this implies that it is not being biased correctly. this behaviour would indicate that the electrode is grounded.
| Figure 2: Pulses from event 20073 in data set 07110829_1849. | |
|---|---|
| Q1 | Q2 |
 |  |
| Q3 | Q4 |
 |  |
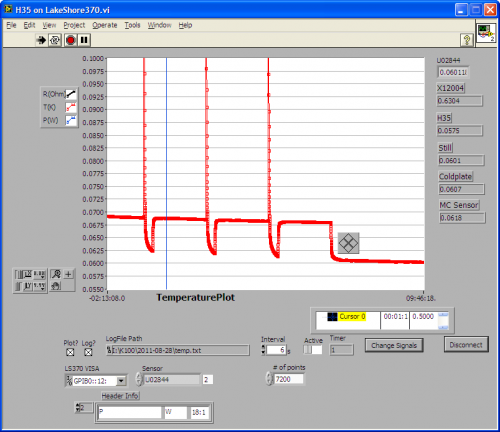
Additionally, the tower temperature seems to rise whenever bias is applied, illustrated in Fig. 3 (left). After each data series, the detector is flashed for 6 s and all charge channels are set to 0 V bias. The detector is then left to cool for 20 minutes before -4 V bias is applied and a new data series is started. It appears that as soon as bias is applied, the temperature rises sharply to some constant offset above base.
| Figure 3: Tower temperature when a uniform bias of -4 V is applied (left) and the bias is increased from -4 V to -6 V to -8 V (right). | |
|---|---|
 | 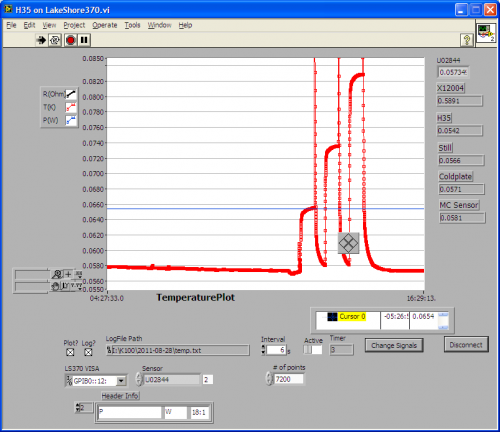 |
The tower temperature is dependent on bias voltage (Fig. 3 (right)); ie. the stronger the electric field, the higher the tower temperature. Observations of the tower temperature at -4 V, -6 V & -8 V biases indicated that this relationship is roughly linear.
Due to the erratic baseline and negative pulses, Q4 seems to be the culprit. This is confirmed when bias is applied to Q4 only, yielding an increase in temperature. Although we suspect that Q4 is grounded, the 40 MΩ resistor on the side coax makes it impossible for us to check this while cold. We can confirm this while dismantling the tower once the run is over.
Q4 at 0 V bias
As the other channels work as expected, we decided to apply 0 V bias along Q4 for the remainder of this run. Four 30-minute runs are conducted at bias voltages of -4 V, -6 V & -8 V applied to channels Q1-3. The trigger ignores Q4. Plots of Qn (n = 1,2,3) as a function of time are shown in Fig. 4, where events with maximum energy deposition in their respective electrodes are shown.
| Figure 4: Qn (n = 1,2,3) as a function of time | |||
|---|---|---|---|
| -4 V bias voltage | -6 V bias voltage | -8 V bias voltage | |
| Q1 | 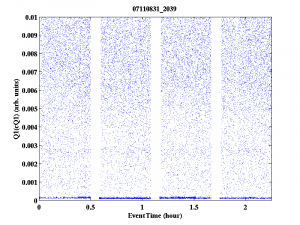 | 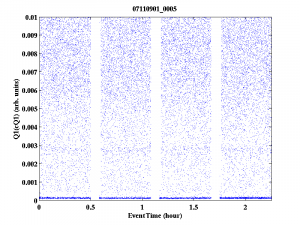 | 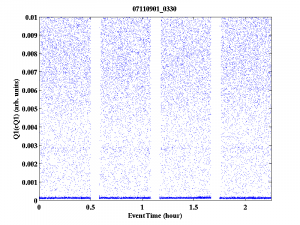 |
| Q2 | 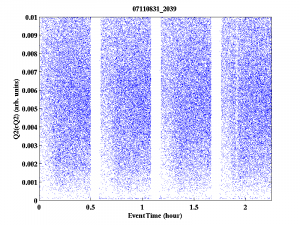 | 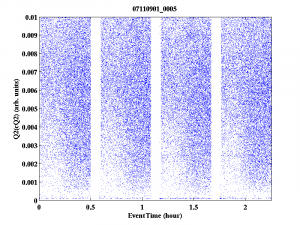 | 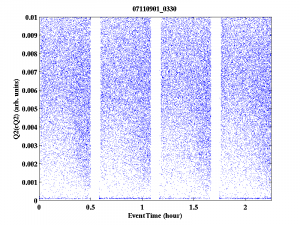 |
| Q3 | 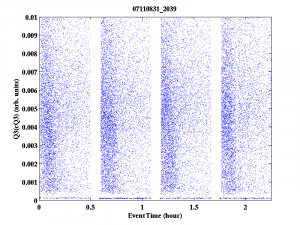 | 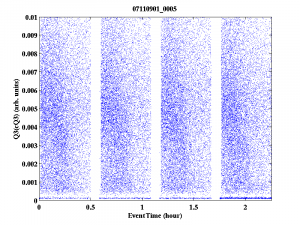 | 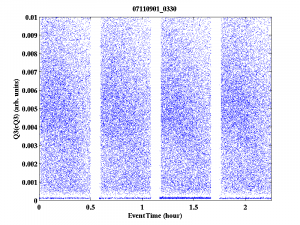 |
There are a couple of interesting features. The 60 keV line is visible in Q1, but absent from Q2 (the electrode the source is facing). This would indicate that the field is not perpendicular to the crystal surface.
The number of events with maximum energy deposition in Q3 decreases with time. Interestingly, this seems to be related to the increase over time of events with maximum energy deposition in Q2. This implies that the electric field varies with time, perhaps due to the “grounding” (not true grounding) of Q4.
The timing of this switch seems to be dependent on electric field strength: the field seems to change shape at a later time when a bias voltage of -8 V is applied along Q1-3. Flashing the detector for 6 s restores the field.
Edelweiss
