Table of Contents
Run 15
Summary
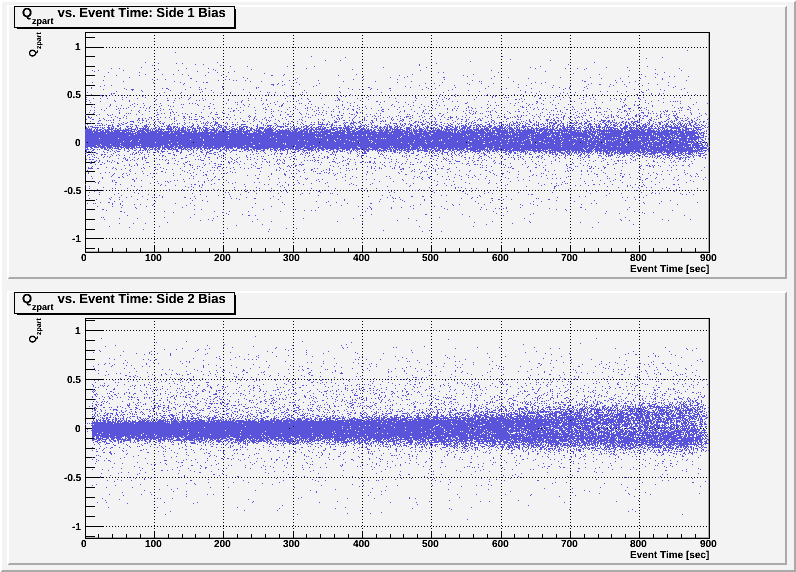
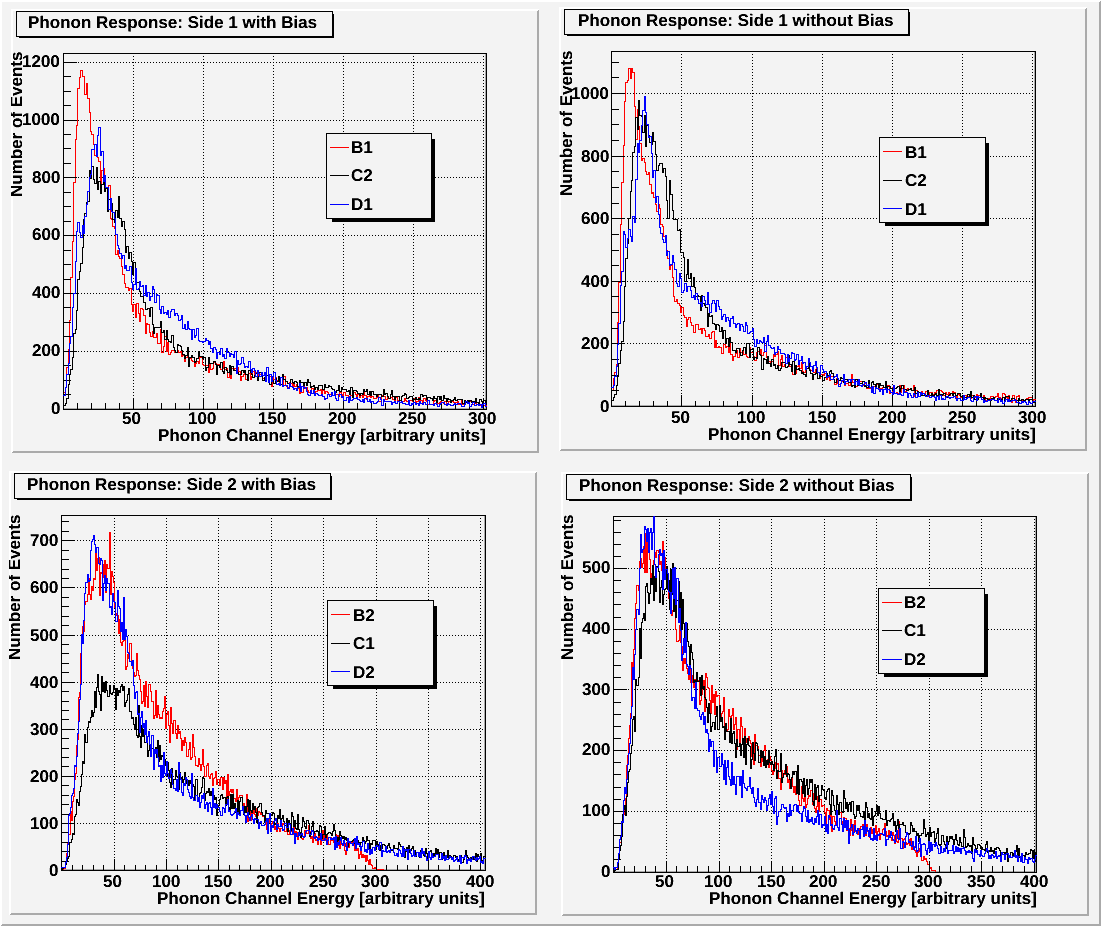
The neutralization holding time of G16K is about 15min. Phonon sensor responses look OK except C1 on Side 2 is a bit weaker. But this could be due to the QET bias point difference.
Setup
| Table 1: Run 15 setup | ||
|---|---|---|
| Detector | G16K | |
| Tower | T1 | |
| DIB | 1 | 2 |
| Face | 2 | 5 |
| Side coax | ZB1-1-9 | ZB1-1-6 |
| SQUET | ZC23 | ZC70 |
| Stripline | #19 | #20 |
| Readout | DCRCv3 | |
Electrical checks at room temperature and 77K were OK. The tower was slowly cooling during the run. The base temperature drifted from roughly 63mk at the beginning of the data taking to ~53mK at the end. We didn't use the Am-241 source this time. Only the external Ba-133 source was used.
Charge stability measurement
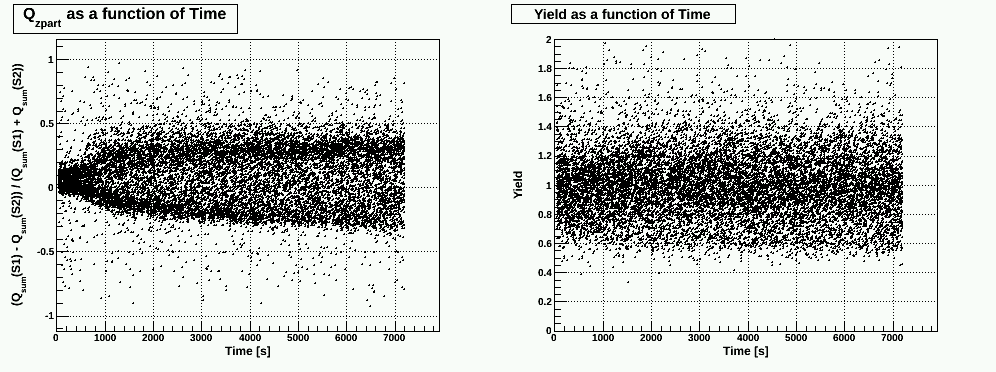
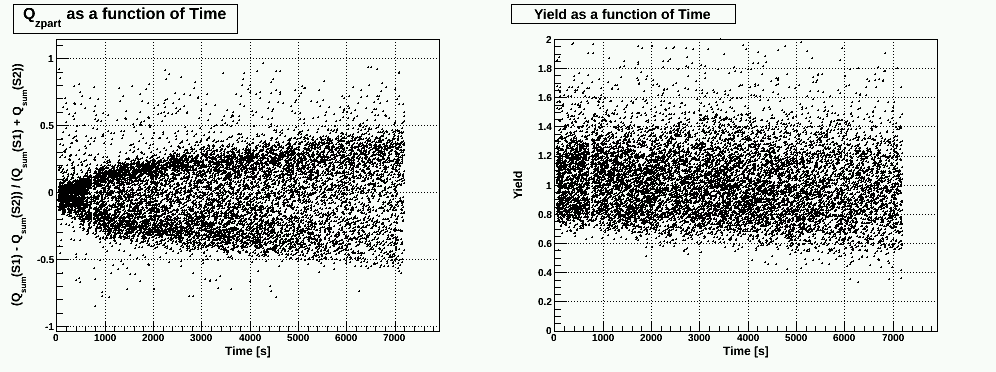
2 Hour long runs
| Figure 0.1. Side 1 -2.5 V bias; Side 2 +2.5 V bias |
|---|
 |
| Figure 0.2. Side 1 +2.5 V bias; Side 2 -2.5 V bias |
|---|
 |
Flipping Bias Data Analysis Results
Data
Data analyzed
S1/S2=
-2.5V/2.5V     0V/0V          +2.5V/-2.5V    0V/0V
07110725_2026  07110725_2042  07110725_2043  07110725_2058
07110725_2059  07110725_2114  07110725_2116  07110725_2131
07110725_2132  07110725_2147  07110725_2148  07110725_2203
07110725_2204  07110725_2219  07110725_2221  07110725_2236
07110725_2237  07110725_2252  07110725_2253  07110725_2308
07110725_2309  07110725_2324  07110725_2326  07110725_2341
07110725_2342  07110725_2357  07110725_2358  07110726_0013
07110726_0014  07110726_0029  07110726_0031  07110726_0046
07110726_0047  07110726_0102  07110726_0103  07110726_0118
07110726_0119  07110726_0135  07110726_0136  07110726_0151
07110726_0152  07110726_0207  07110726_0208  07110726_0223
07110726_0225  07110726_0240  07110726_0241  07110726_0256
07110726_0257  07110726_0312  07110726_0314  07110726_0329
07110726_0330  07110726_0345  07110726_0346  07110726_0401
07110726_0403  07110726_0418  07110726_0419  07110726_0434
07110726_0435  07110726_0450  07110726_0452  07110726_0507
07110726_0508  07110726_0523  07110726_0524  07110726_0540
07110726_0541  07110726_0556  07110726_0557  07110726_0612
07110726_0613  07110726_0629  07110726_0630  07110726_0645
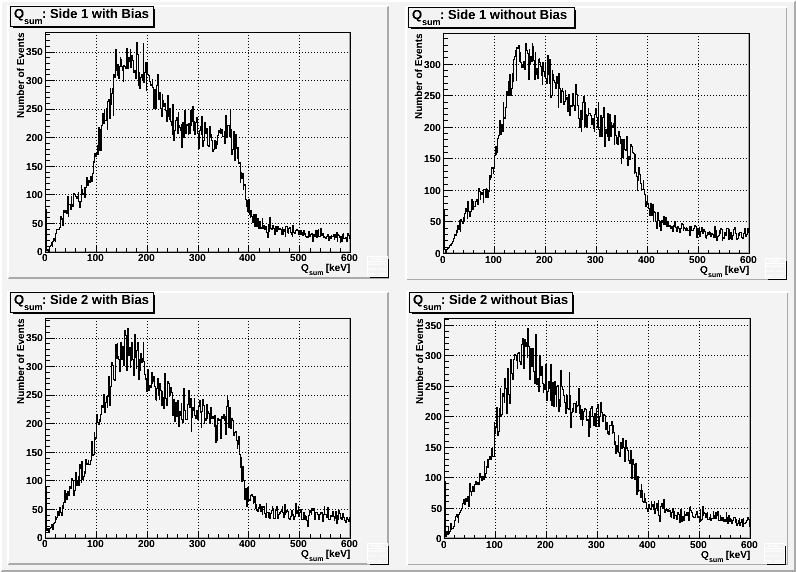
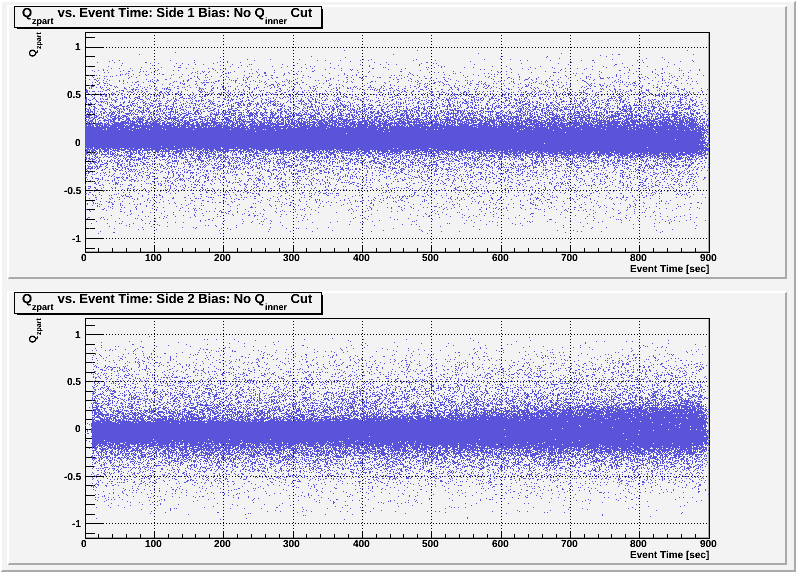
Bulk, Qinner, and ChiSq cuts were used.
Plots
| Figure 1: Charge Spectrum. |
|---|
 |
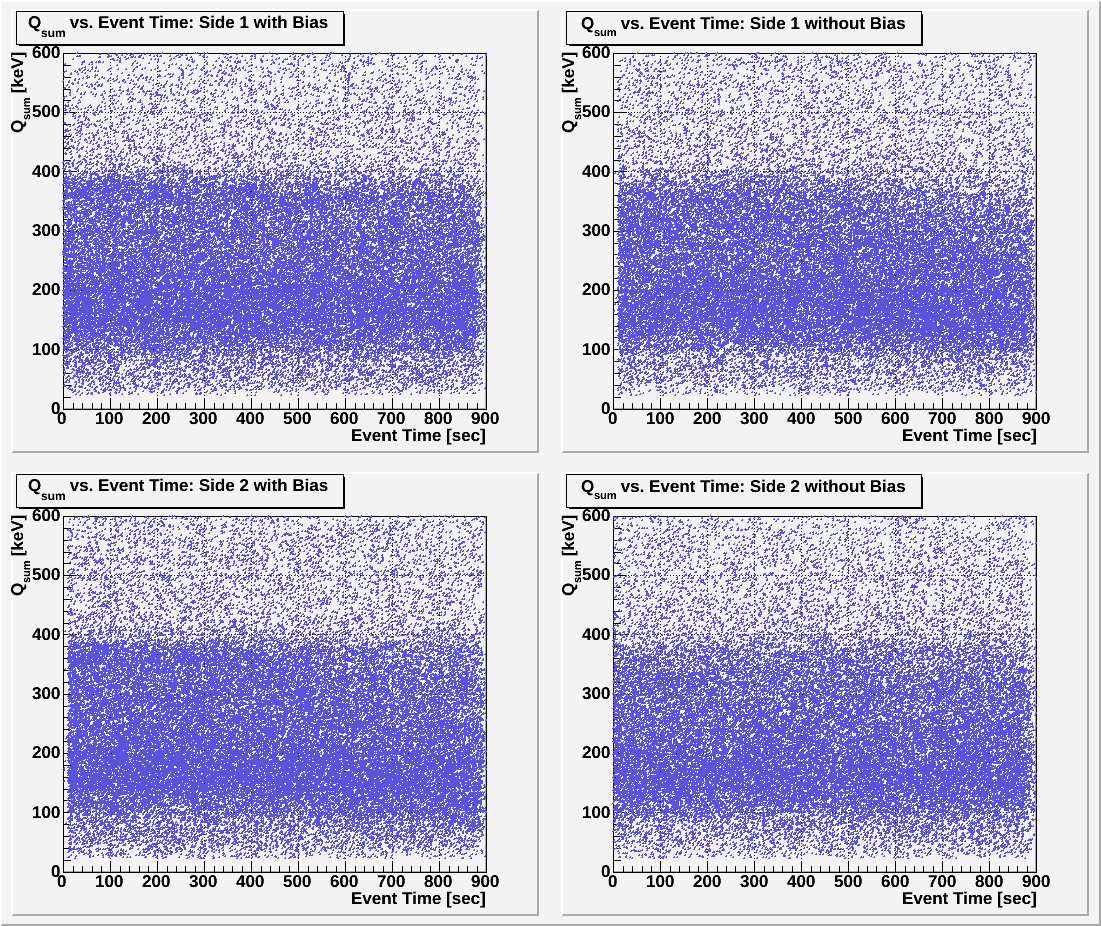
| Figure 2: Qsum as a function of time. |
|---|
 |
| Figure 3: Qzpart as a function of time. |
|---|
 |
| Figure 4: Qzpart as a function of time with no Qinner cut. |
|---|
 |
| Figure 5: Phonon channels response. |
|---|
 |
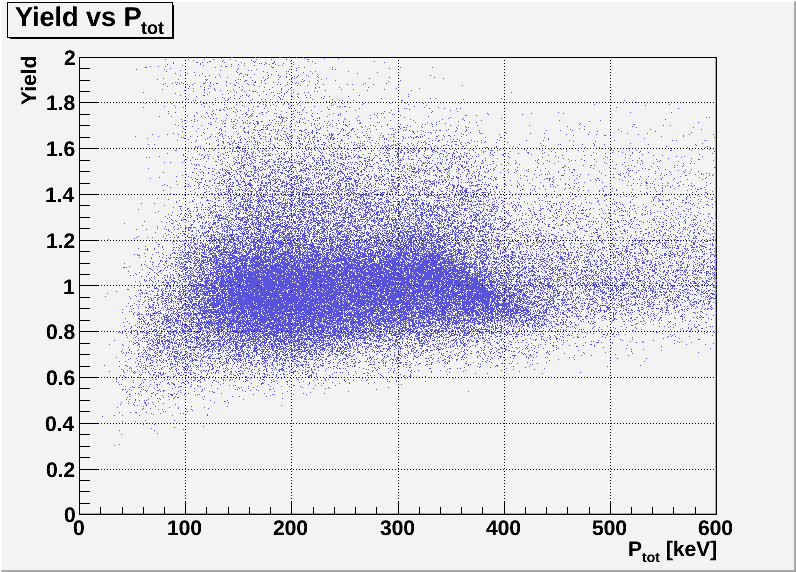
| Figure 6: Yield as a function of phonon energy. |
|---|
 |
| Figure 7: Yield as a function of time. |
|---|
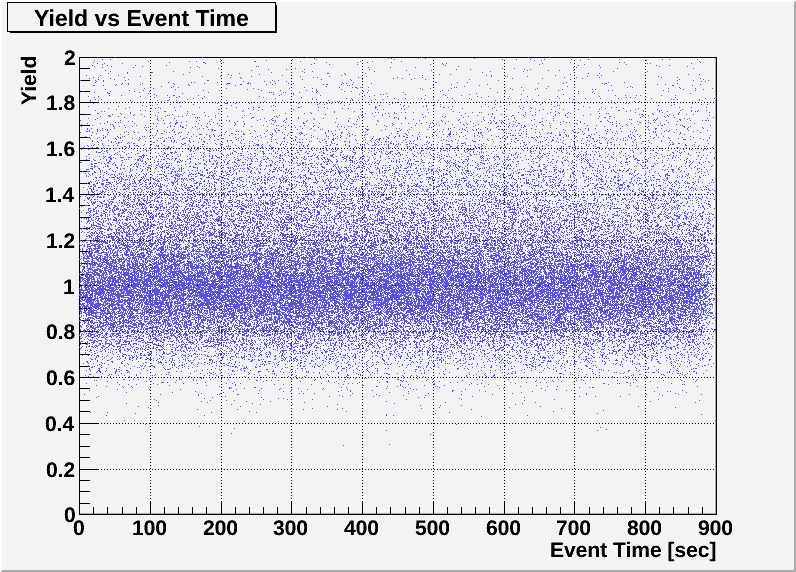 |
| Figure 8: Yield as a function of time for first 2 hours. |
|---|
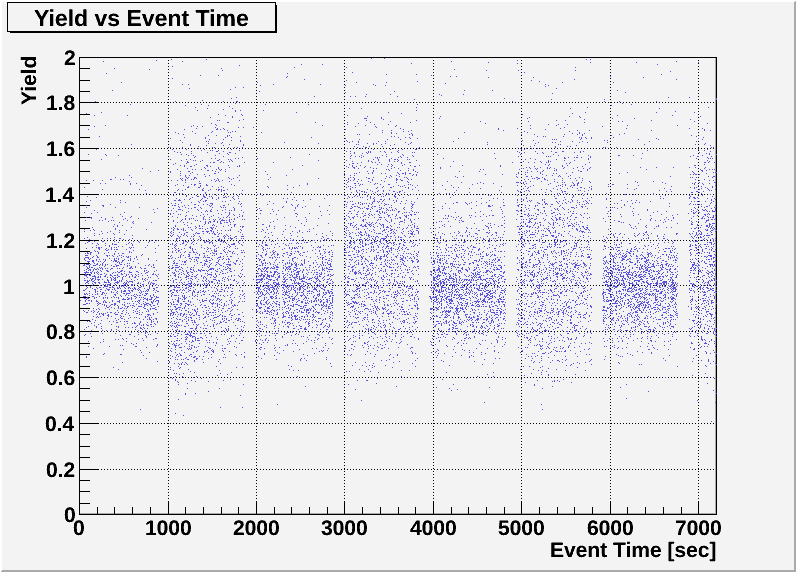 |
| Figure 9: Qzpart as a function of time for first 2 hours. |
|---|
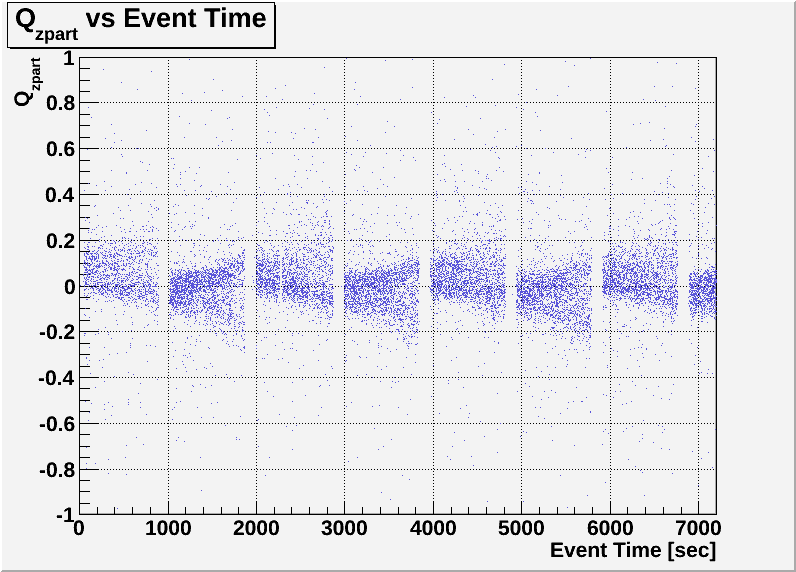 |