2022/08/22 (Monday)
- Lab in-personnel: Giulia, Himangshu
| Status | Run 76 in progress |
|---|---|
| Setup | Cables 2/3/1 → diverter/nothing/nothing → Side2-readout HV CONN 1/3/2 → HV 1(L)/2(R) → DCRC50(3)/DCRC55(1), DCRC33(2)→HV control, NaI trigger signal → DCRCX(4) Lead/poly shield fully assembled. Boron-filled socks covering NaI detectors. PuBe behind lead wall on West side of lead/poly shield. |
| Suspended circulation and stopped 1K Pot on Friday. Pumped out the IVC overnight with fridge >4K. Yesterday started 1K Pot and circulation again. | |
| 1100 | MC/Coldplate = 29.1/144 mK, Still = 1.10K / 0.080 mbar / 0 mW, G1/G2 = 230/211 mbar, 1K Pot = 45° / 1.43 K / 18±1 mbar, MB = 66.5 % |
| 1111 | Begin LN2 transfer |
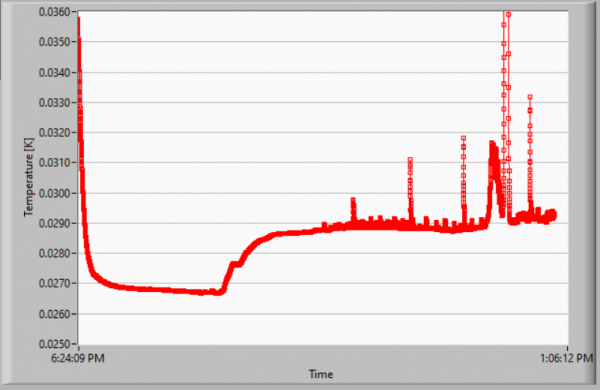
| Sadly, as seen in the plot above, warming up the fridge enough to pump helium out of the IVC was not a permanent fix. Yesterday's cooldown went well at first but around midnight the MC temperature increased, and later temperature spikes started happening again. | |
| 1405 | Stare DCRC1&3 and DAQ programs. Pulses look OK. In fact they may look better - seeing some wide pulses, and also DCRC3 is currently not showing oscillations (though it looks like it may be kinda high in its transition… which also may be a good sign…) |
| 1505 | MC temperature has increased since turning on DCRCs, 29→31.5 mK |
| 1515 | Zap SQUIDs with DCRCs 1&3 |
| 1545 | Mini-IbIs on DCRC1pA, for dP/dI = 1 uV QET bias = 179.8, previously 222.0 |
| 1605 | Mini-IbIs on DCRC1pB, for dP/dI = 1 uV QET bias = 181.8, previously 225.3 |
| 1620 | Mini-IbIs on DCRC1pD, for dP/dI = 1 uV QET bias = 224.4, previously 277.7 |
| 1645 | Mini-IbIs on DCRC3pA, for dP/dI = 1 uV QET bias = 192.8, previously 229.3 |
| 1810 | Mini-IbIs on DCRC3pB, for dP/dI = 1 uV QET bias = 188.5, previously 221.0 |
| 1825 | Mini-IbIs on DCRC3pD, for dP/dI = 1 uV QET bias = 202.7, previously 242.0 |
| 1828 | Start 0 V PuBe data series 50 min long, with 1000 initial randoms, 5 Hz in-run randoms, trigger on DCRC3pB threshold 10. Start series with the Start Button. |
| 1918 | towerfe3_01 crashed, so only 50 dumps worked. Good enough. |
Analysis notes:
- This data looks better. The 0V data before the recent 4K warmup/pumpout was quite bad, could not see any Am peaks. Here the Am peaks are back.
- Amplitudes in the 0V data before 4K warmup/pumpout were very low. In this new data they are much higher but a bit lower than early data (before the blockage)
- Pulse widths were much shorter in the 0V data before the 4K warmup/pumpout. In the new data they are actually longer than in early data, as if saturation is occurring earlier.
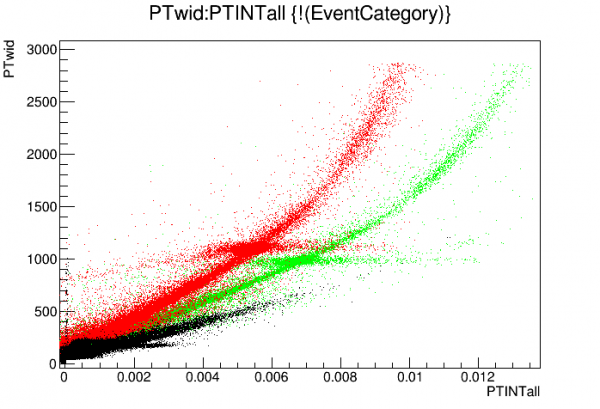 |
| Green: 0V 07220711_0828, before blockage Black: 0V 07220812_1805, after 100K warmup/recool Red: 0V 07220822_1828, after 4K warmup/pumpout |