2022/03/23 (Wednesday)
- Lab in-personnel: Matt, Anthony, Kitty, Megan
| Status | Run 76 in progress |
|---|---|
| Setup | Cable 2/1/3 → diverter/nothing/nothing → DCRC 1/3/4 |
| 1000 | MC/Coldplate = 28.9/140 mK, Still = 1.16 K / 0.130 mbar / 0 mW, G1/G2= 78/88 mbar, 1K Pot = 18° / 1.67 K / 34±2 mbar. |
| 1115 | Goldman = 79.5 mK, MB = 51.1% |
| 1120 | Try varying the LakeShore voltage excitation to see how it affects the Goldman temperature readout. 200 uV → 79.5 mK 632 uV → 78.9 mK 2.0 mV → 78.6 mK 6.32 mV → 78.8 mK so it seems that the lowest temperature readout occurs at 2.0 mV excitation, which is pretty high. Typically we set it to something like 20 uV. |
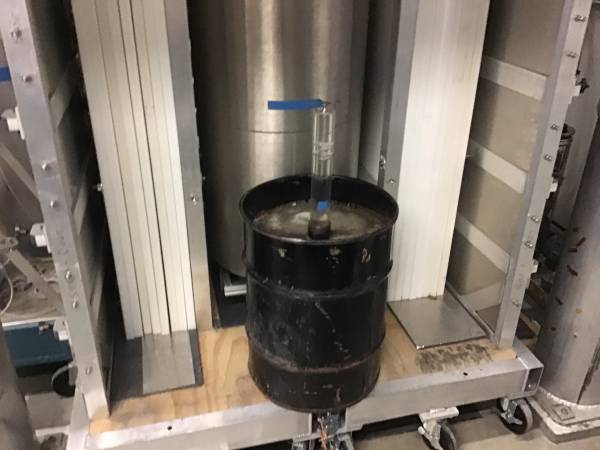
| 1205 | Bring PuBe source in paraffin drum into lab, place on north side of shield platform right next to fridge. This is to calibrate NaI detectors with high energy gamma lines. |
| 1210 | Try different LakeShore excitations with the H35 thermometer: 2.0 mV → 28.8 mK 632 uV → 29.0 mK 200,63,20 uV → 28.8 K 6.3 uV → VMIX OL so for this thermometer we want excitation no greater than 200 uV (but 6.3 uV is too low) |
| 1240 | Trouble connecting to HV supply for NaI array. Return PuBe source to howitzer on 4th floor |
| 1250 | Connection problem solved: bad lemo cable for the HV interlock, swapped it out. |
| 1255 | Bring PuBe source back into lab. |
| 1300 | Conducting NaI calibration with PuBe source. Matt in lab, others have been exiled from lab while source is present. Take 3 minutes of data for each of the 23 NaI detectors one at a time. |
Procedure for PuBe calibration of NaI detectors:
- Turn off HV on channel n, turn on HV on channel n+1 (GECO2020 on computer)
- Disconnect signal cable n+1 from multichannel digitizer at crate, plug it into cable leading to desktop digitizer
- Reconnect signal cable n to multichannel digitizer at crate
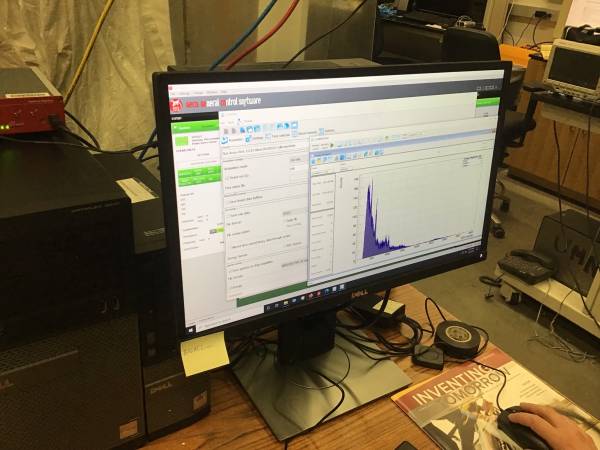
- Update filename with Det# and HV setting (HV setting for each detector is saved in the HV control program) (CoMPASS on computer)
- Hit Start button to start data collection. Histogram will start filling. (CoMPASS Plot on computer)
- Wait till histogram is finished (it is set to 180 seconds livetime)
- Take snapshot of histo using camera button
- Repeat (n = 1 to 23)
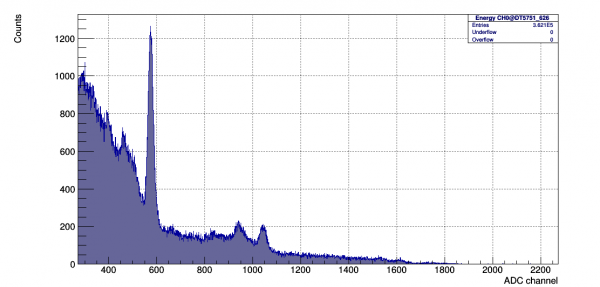
| As we've seen with NaI data taken previously (with the old cylindrical NaI detectors), there are prominent peaks at 2.1 MeV (n-capture on H-1) and 4.438 MeV (C-12 deexcitation). These seem to be quite linear in the NaI spectrum along with 1.4 MeV from K-41 background (which has been calibrated to x=400 on all the NaI detectors). Also see single-escape and double-escape lines from the 4.4 MeV | |
| Also seeing a small peak around 7.1 MeV with a Compton spectrum to the left of it extending back to the much larger 4.4 MeV. This may be from a higher C-12 excitation state (though that should probably actually be 7.6 MeV…?). Could be some capture line on some other material in the lab. | |
| 1450 | Finish PuBe-gamma calibration of NaI array |
| 1500 | Return PuBe source to howitzer storage in PAN 443 |
| 1626 | Begin LHe transfer @ MB = 43.6% |
| 1654 | End LHe transfer @ MB = 91.8% |
 | ||
 |  |  |