2018/06/26 (Tuesday)
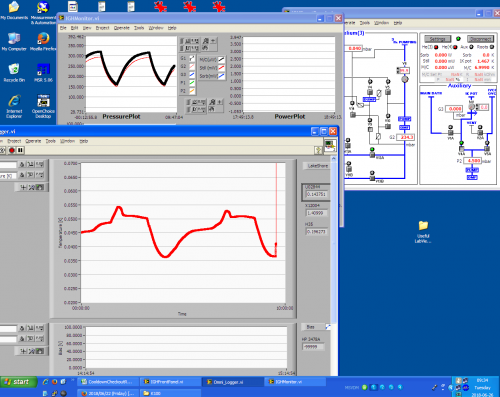
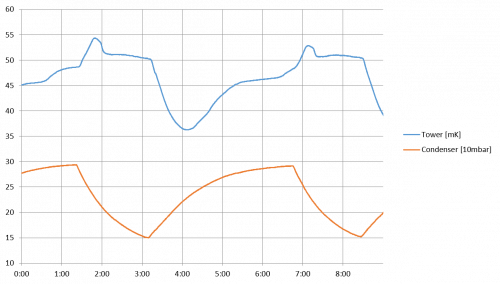
| overnight: Tower and circulation pressures oscillating. Tower going between 36 mK and 55 mK and G1 between 150 mbar and 310 mbar. Period is about 5 hours. |
 |
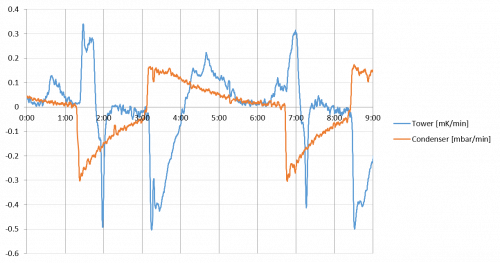 |
| Starting at the pressure minimum, the cycle is this: pressure suddenly starts rising accompanied with strong fall in temperature. Temperature reaches a minimum, then rises again, while pressure continues to rise but more slowly. Pressure rise flattens and temperature plateaus. Then pressure suddenly starts falling, accompanied by rise in temperature. Temperature peaks, falls a little, then plateaus. Then pattern repeats. | |
| 0930 | Tower/MC/Coldplate = 36.5/36.3/188 mK, Still = 1.14 K / 0.040 mbar / 0 mW, G1/G2 = 254/237 mbar, 1K Pot = 1.47 K / 5.0 mbar. MB = 75.6% |
| 0940 | Fill LN2 cold trap full |
| 0950 | Currently the Tower temperature is just past the bottom of its oscillation curve, beginning to rise. Try applying 1 mW to Still heater |
| 1010 | Temperature has wiggled since applying still heat. Dropped from 38 to 37 mK, then a couple wiggles between 37 and 38. We seem to have broken the pattern of the 5-hour oscillation at least. Meanwhile circulation pressures have been rising, now G1/G2=316/295 mbar, close to the maximum of the 5-hour oscillation. Still is at 0.06 mbar. |
| 1030 | Tower temperature wiggled some more, reaching minimum 36.8 mK, but now is suddenly rising sharply, faster than the rises during the 5-hour oscillation. G1/G2 continuing to rise. |
| 1040 | G1/G2 seem to have peaked at 368/342 mbar, now coming down. Tower still rising, now at 54.5 mK. Both the circulation pressures and the tower temperature are now higher than the maximum during the 5-hour cycle. |
| 1110 | Tower peaks at 78 mK, now falling. G1/G2 continue to fall, now 334/311 mbar. |
| 1440 | For the last couple of hours Tower has been falling slowly, now 40.7 mK. G1/G2 were falling and now basically flat, 288/269 mbar. Hard to say whether we'll go into another cycle like last night but right now it doesn't look very similar |
| 1520 | Tower = 40.3 mK |
| 1520 | Let's try running the detector. Power on DCRCs and start DCRC programs in MIDAS. Tower spikes to 200 mK, but quickly cools. |
| 1525 | Tower = 52.3 mK and falling |
| 1540 | Tower = 45.4 mK, falling more slowly. |
| 1550 | Tower hit a minimum of 44.9 mK, but now is slowly rising for the heck of it, reduce Still power from 1 mW down to 0.5 mW. (Partly inspired by the fact that circulation pressures were rising.) Maybe this will curb the temperature increase. |
| 1600 | Warming had slowed down, but then started rising more quickly. Also pressures were going down. Increase Still from 0.5 mW back to 1 mW, see if we can stabilize it. |
| 1615 | Temperature stopped increasing, peaked at 46.2 mK, now at 45.2 mK. |
| 1630 | Fill LN2 cold trap bath |
| 1645 | Tower has drifted up to 47.5 mK, circulation pressures rising. Try decreasing Still heater 1.0 → 0.5 mW |
| 1652 | Fill HPGe dewar from large LN2 dewar. |
| 1655 | Looks like the tower temperature is peaking at 49.5 mK and maybe about to come down again. |
| 1815 | Tower peaked at 50.4 mK and has been falling for the last hour, now at 45.9 mK |