2017/02/03 (Friday)
| Setup: DIB1/3/4 → 3.2 MHz filters → cables → nothing/DCRC55(1)/nothing | |
| 1108 | Tower/MC/Coldplate = 38.1/31.6/184.6 mK, Still = 1.1 K / 0.110 mbar, G1/G2 = 166/144 mbar, 1K Pot = 1.769 K / 30 mbar, Main bath = 21.0%. Boil off rate: faster than slow mode. |
| 1120 | Start LHe transfer (MB = 20.5%) |
| 1155 | Finish LHe transfer (MB = 96.0%) |
| 1210 | Release pressure from MB. |
| 1210 | Fill LN2 cold trap full. |
| 1255 | Re release pressure from MB. |
| 1420 | Checking DIB3pB (DCRC1pB) to see how changing the front-end gain introduces high-frequency oscillations in the output. Looking at PSD in pulse viewer and width of baseline. The frequency is about 400 kHz. |
| Front-end gain sweep of DIB3pB, using DCRC1 | |||
|---|---|---|---|
| Front-end Gain | Peak visible? | Peak amp | Baseline mVpp |
| 1 | no | 0.000001 | 7 |
| 2 | yes | 0.000002 | 8 |
| 5 | yes | 0.00001 | 12 |
| 10 | yes | 0.00004 | 13 |
| 20 | yes | 0.00009 | 26 |
| 50 | yes | 0.0005 | 115 |
| QET bias = 140 μA, Driver gain = x8 At 50, pulses look pretty weak compared to baseline width Observation: Oscillation amplitude is prop. to gain∧1.6 |
|||
| 1450 | Now try IbIs in the superconducting region using different front-end gain settings, see if there is a difference as was observed at UCB. |
|---|
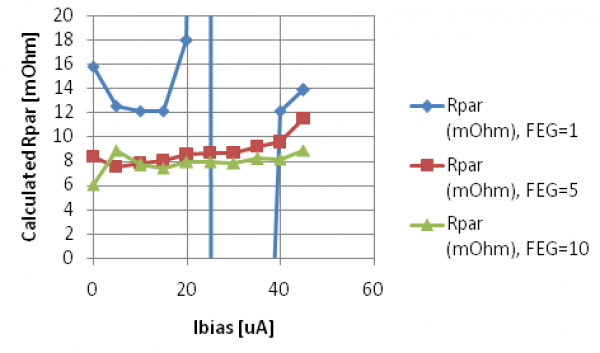 |
| As at UCB the calculated Rpar is lower when front-end gain is increased. Note that FEG=5 is our standard from previous runs |
| 1550 | Now we will do IbIs measurements in the normal region for DIB3pB with front-end gains 1, 5, 10 - Ibias 300 to 500 uA, Driver gain x4 Strangely at the higher biases the IbIs curve changes slope significantly. I haven't seen this before but usually I dont' take the IbIs curve out this far. |
|---|
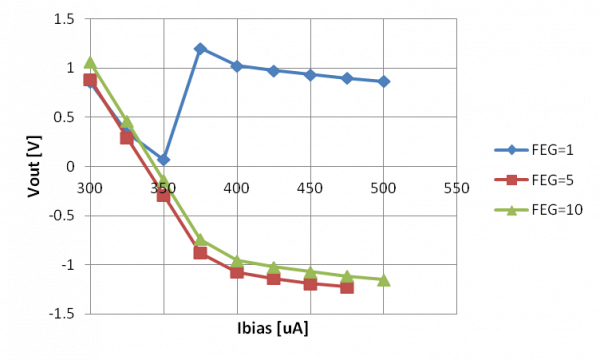 |
| With front-end gain = 1 there is a SQUID phase jump The change in slope above 375 μA is mysterious |
| 1650 | Now we will do IbIs measurements in the normal region for DIB3pB with front-end gains 1, 5, 10 - Ibias 175 to 300 uA, Driver gain x2 |
|---|
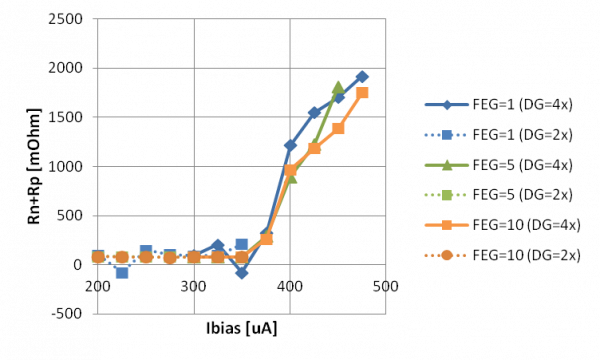 | 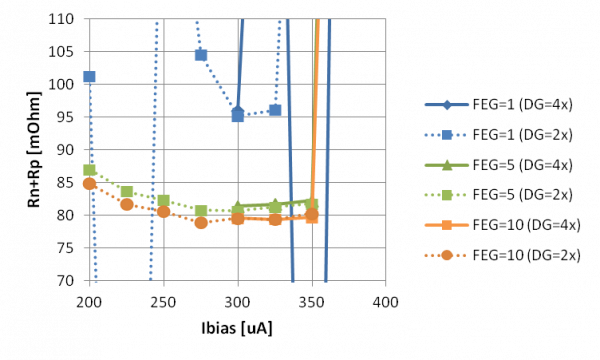 |
| The different slope above 375 μA implies high resistances, but they are not constant | The calculated normal resistance is somewhat smaller with front-end gain 10 instead of 5 |
| Of interest is whether the normal part of the IbIs curve looks any more linear at higher front-end gains. In Run 61 it was difficult to calculate the voltage offset using the normal portion of the curve because the normal part was not linear (it was approximately quadratic). The plot below shows the slope of the raw IbIs curve in the normal region: |
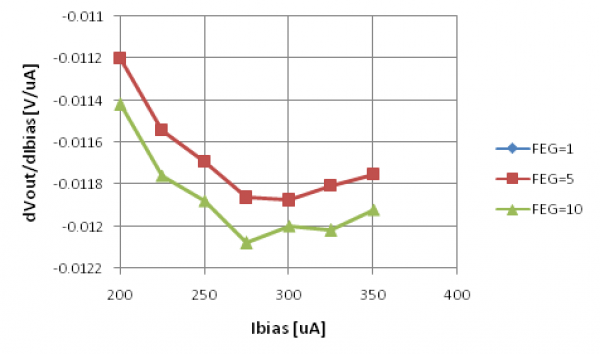 |
| The slope is not constant, so the normal part of the IbIs is not linear, at either front-end gain = 5 or 10. Below 300 μA the curve may be starting to enter the transition region. Above 300 μA it appears quadratic and concave up. |
| 1702 | Fill LN2 cold trap full. |
|---|