Table of Contents
2014/05/04
| 1300 | Tower temperature 76.3 mK. Looks like some playing around will be required to shave off 1-2 mK. |
|---|---|
| Fill N2 cold trap full. | |
| 1900 | Tower temperature 75.9 mK. Temperature of 1 K pot 1.59 K. Attempt to reduce 1 K pot temperature by closing needle valve; monitor to determine if it remains stable. |
G106a Neutralisation Study
Previous runs indicate that biases of +/-3.5 V & -/+3.5 V arguably provide the lowest electric field strength across the crystal bulk for acceptable charge collection efficiency. In order to increase the time between flashes, thus increasing the efficiency of data acquisition, a study of the time taken before the crystal loses neutralisation under these biases is required.
-/+3.5 V Bias
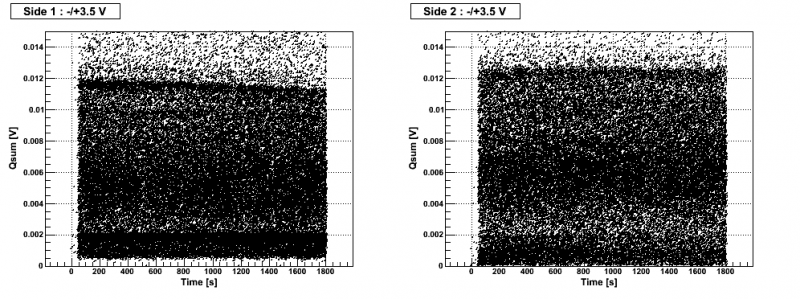
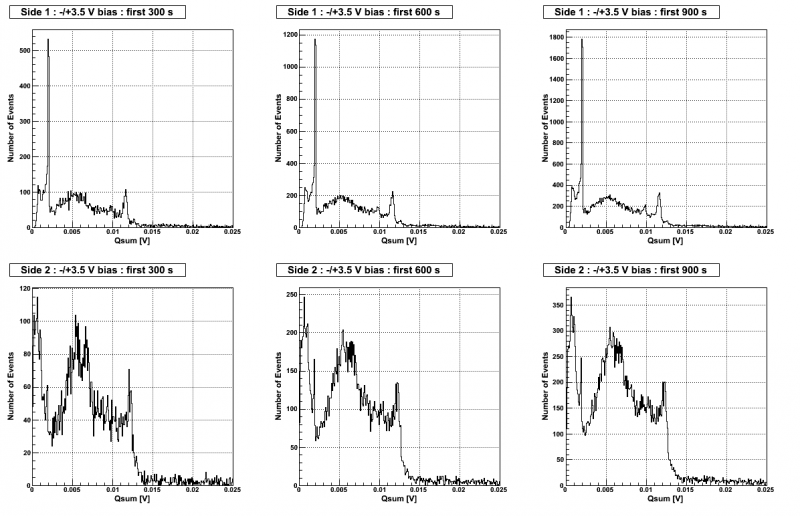
From Fig. 1, when looking at Side 1 (the side collecting holes), it seems as though the crystal becomes deneutralised after approximately 15 minutes (900 s). This is confirmed when looking at the Qsum histograms at 5-minute intervals in Fig. 2. There does not appear to be any deterimental effect on the 356 keV peak on either side during the first 15 minutes of data acquisition. Additionally, the 60 keV peak also appears to be unaffected. Therefore, it appears as though the data acquisition time between flashes can be extended from 5 to 15 minutes when biasing the crystal at -/+3.5 V.
| Figure 1: Qsum as a function of time at -/+3.5 V bias for Side 1 (left) & Side 2 (right). |
|---|
 |
| Figure 2: Qsum histograms at -/+3.5 V bias for first 5, 10 & 15 minutes. |
|---|
 |
+/-3.5 V Bias
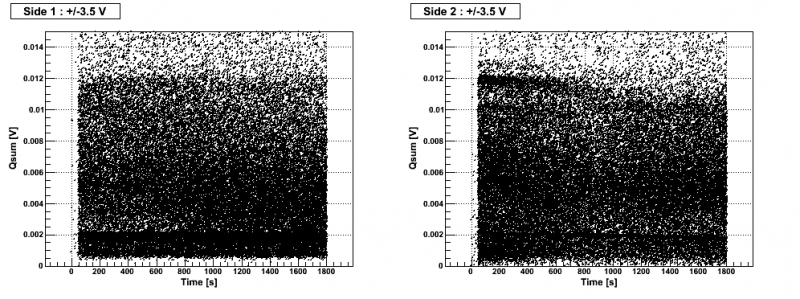
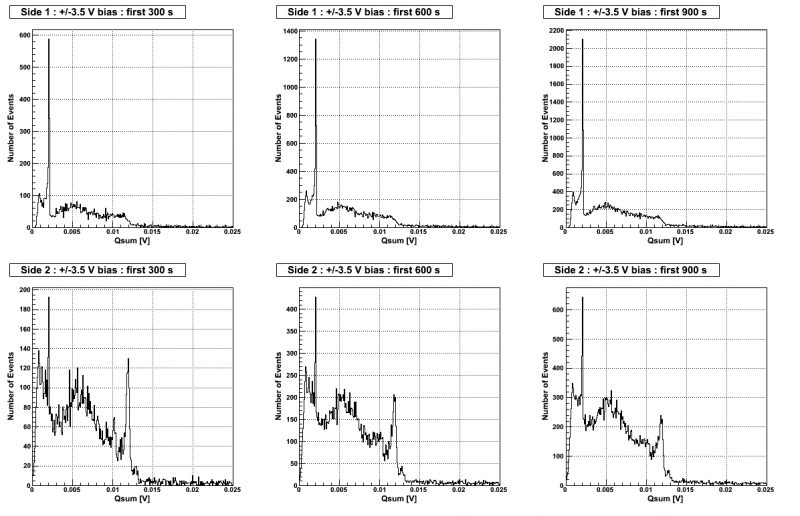
The situation when flipping the polarity is a little more complicated. In Fig. 3, when looking at Side 2 (the side collecting holes), the crystal appears to lose neutralisation within the first 10 minutes (600 s). The 356 keV peak on Side 2 in Fig. 4 appears to become wider when the first 15 minutes (900 s) of data has been acquired. In the same figure, the 356 keV peak on Side 2 looks acceptable after the first 10 minutes (600 s).
Worryingly, the 356 keV peak is not visible on Side 1 in any distribution at this bias. Side 1 does electrons, and electrons are messy, however the 356 keV peak was visible on Side 2 at -/+3.5 V bias as shown in Fig. 2 above. It is possible that 356 keV events are being dwarfed by the 60 keV gamma-rays from the Am-241 source facing Side 1.
For the purposes of this run, it may be acceptable to acquire data over a period of 10 minutes between flashes when the crystal is under +/-3.5 V bias.
| Figure 3: Qsum as a function of time at +/-3.5 V bias for Side 1 (left) & Side 2 (right). |
|---|
 |
| Figure 4: Qsum histograms at +/-3.5 V bias for first 5, 10 & 15 minutes. |
|---|
 |