2014/04/22
| 1125 | Fill N2 cold trap full. |
|---|
IbIs Curves & Resultant QET Biases
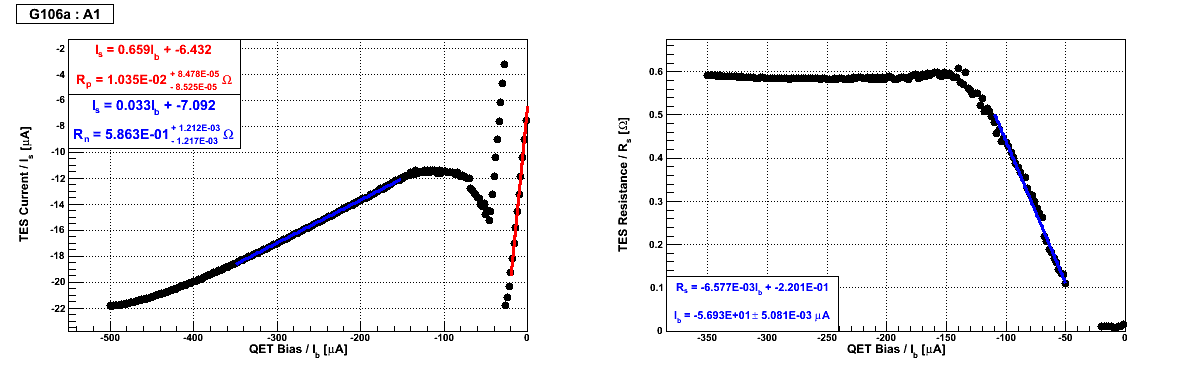
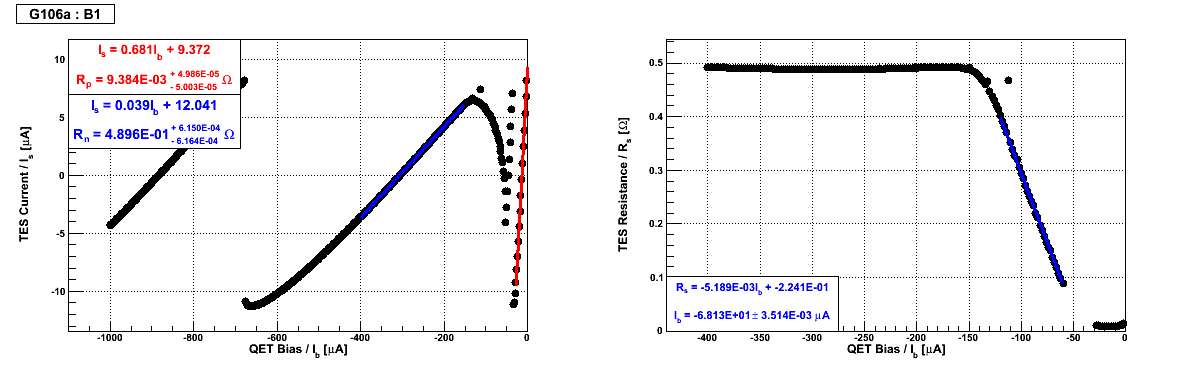
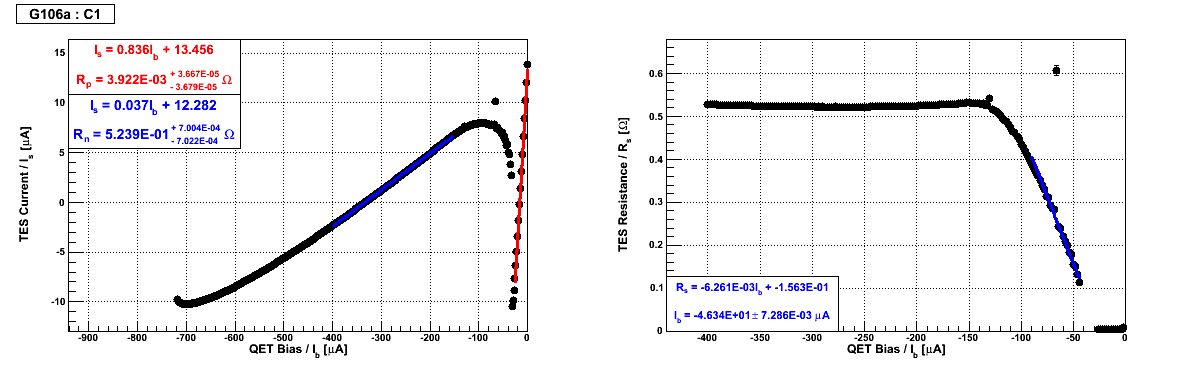
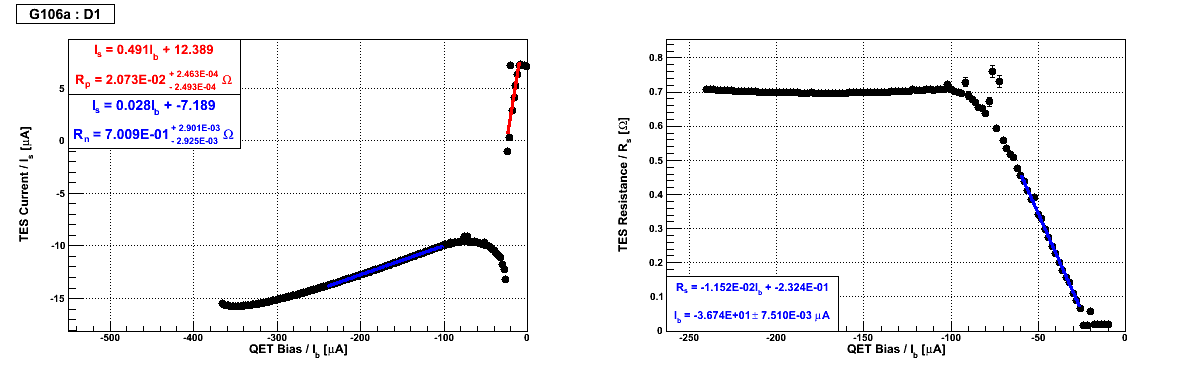
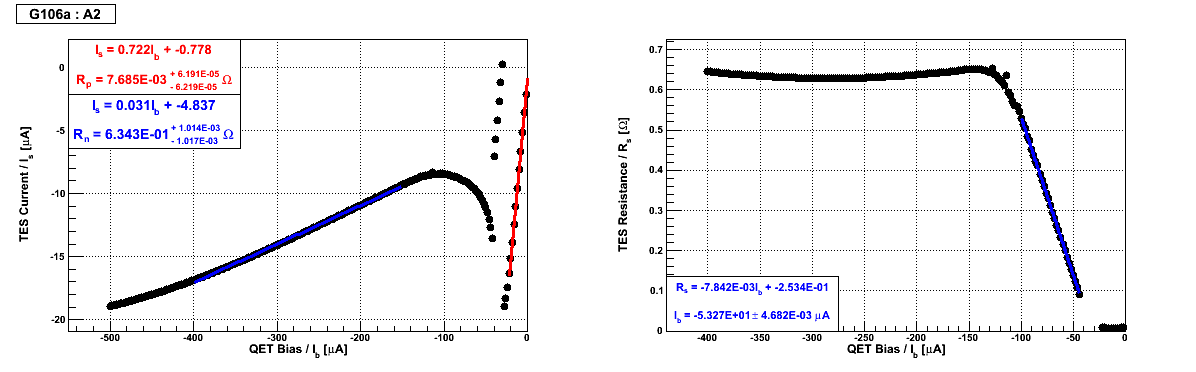
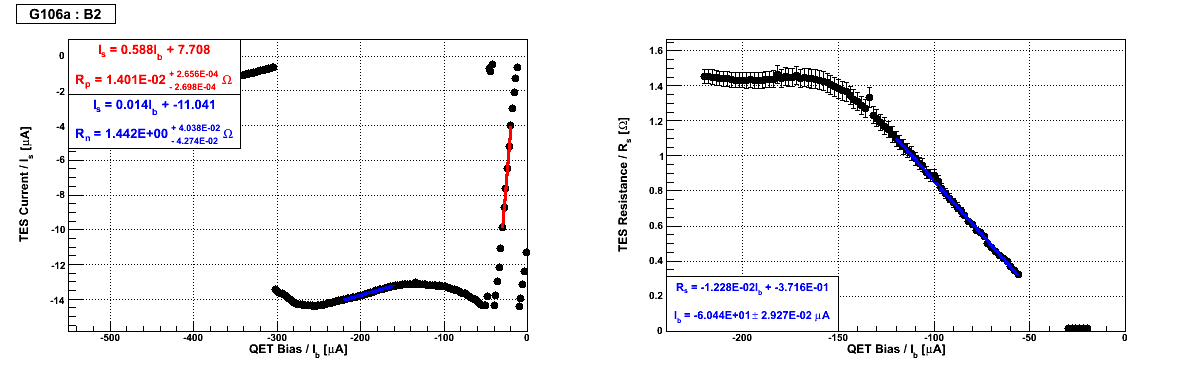
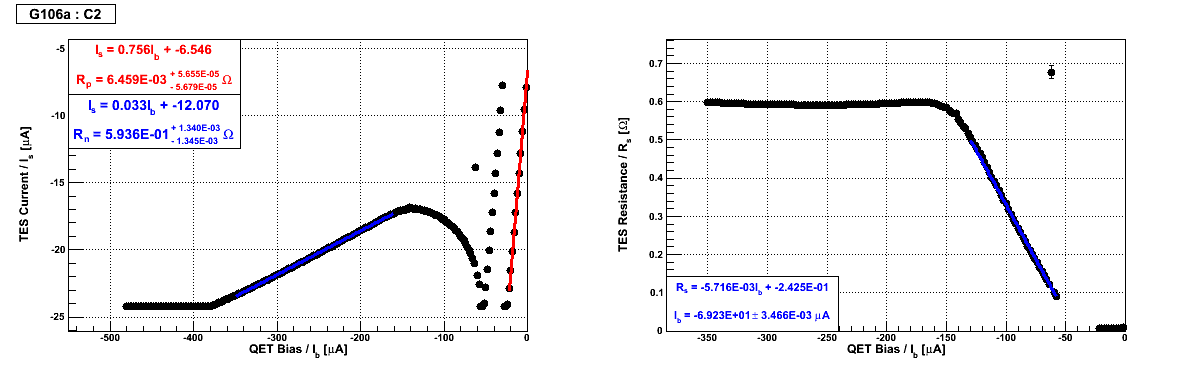
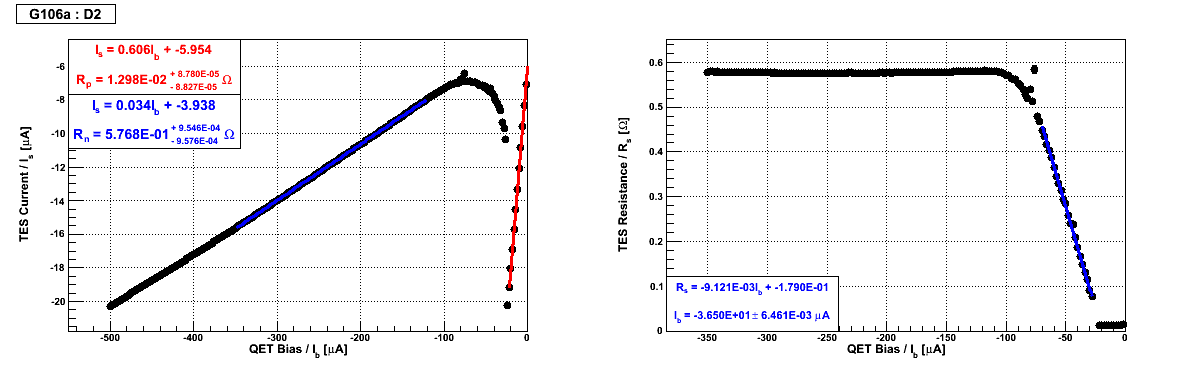
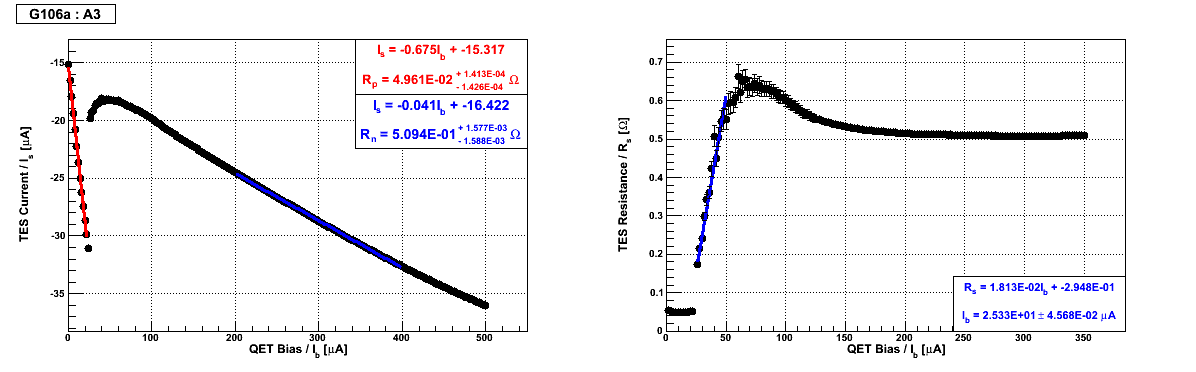
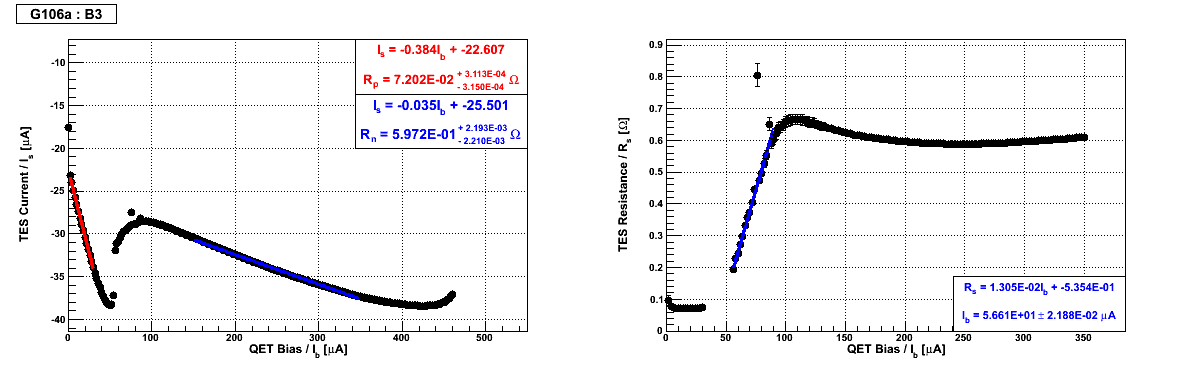
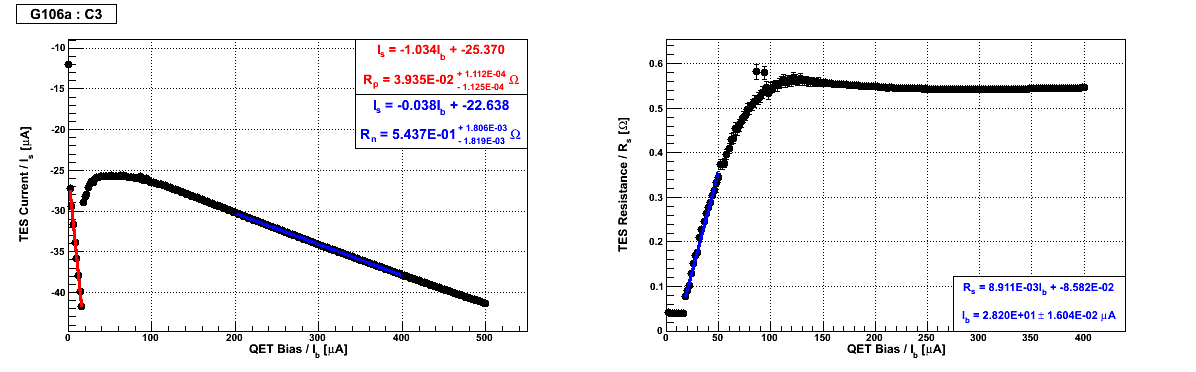
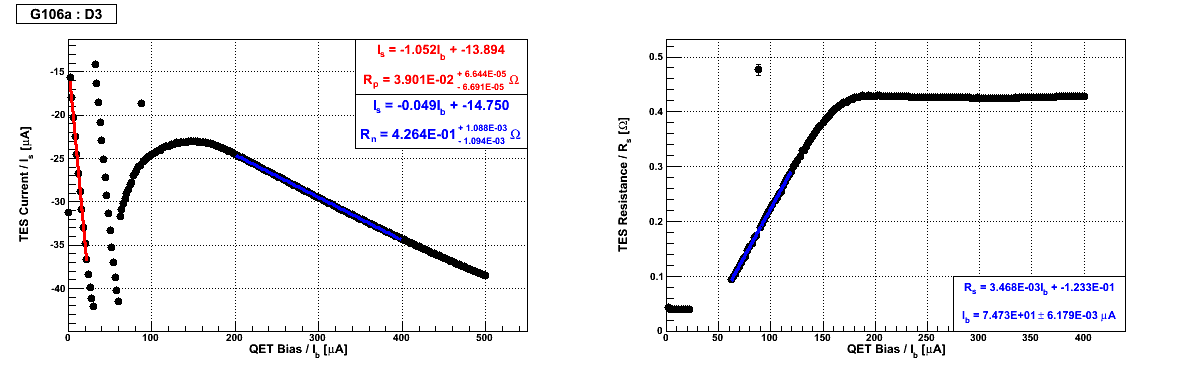
For each channel, the normal resistances Rn, parasitic resistances Rp, QET bias at start of transition region and QET bias at Rn/4 derived from the IbIs and IbRs curves in Fig. 1 are given in Table 1. The current QET biases are listed on the same table for comparison.
It should be mentioned that the QET bias at Rn/4 is actually calculated by from the following formula for the resistance of the sensor Rs:

Rp is non-zero, so we are interested in the difference between Rn and Rp rather than simply Rn. Having said this, Rp is usually small enough that it can be ignored. This is certainly the case when looking at DIBs 1 & 2. The situation with DIB 3 shall be discussed in more detail below.
The fixed gain on the DCRC Rev. C boards is 5. In the case of the Rev. C.1 boards, this fixed gain is halved. Both DCRC boards feature a damping resistor of 33 Ohms on the feedback loop. This should make little difference compared with the 1 kOhm resistor in series on the same loop at the 4.2 K stage (it's on the SQUET card). As Vuk pointed out, the resistance of this resistor at 4.2 K is unknown, so this is at best an estimation. However, the 33 Ohm damping resistor has been incorporated into the calculation for gain.
Other contributing factors remain the same for both boards: driver gain of 1; and inductor coil ratio of 10 to 1. Is (current through TES) is given by:
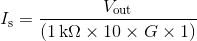
where G is the fixed gain on the DCRC. The resistance of the sensor Rs is given by:
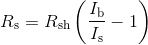
where the resistance of the shunt resistor Rsh is 20 mOhms. The parasitic resistance can be calculated when the sensor is superconducting (ie. at low QET biases before the transition region is reached). In a similar fashion, the normal resistance can be determined by taking the gradient of the line once the QET bias is high enough to drive the sensor normal.
As shown in Table 1, for most of the channels we have overestimated the QET bias. It's a slight overestimation of around 10 uA in most cases, so is likely to make little difference.
There are a few exceptions. It appears as though channel C2 was underestimated by almost 10 uA. Again, this isn't a high difference and probably won't have much of an effect. Channel A3 was overestimated by a larger than expected amount a little shy of 25 uA. Looking at A3's relatively small transition region, that may make a little difference.
Comparing QET bias values at transition and those calculated at Rn/4, the latter lie comfortably far away from the former for phonon channels on DIBs 1 & 2. However, for channels A3 & B3, the calculated “optimal” QET biases lie extremely close to the start of the transition region. We should consider increasing them by 5 uA or so to be safe.
With the exception of channel B2 (and arguably D1), the normal resistances Rn extracted from the IbIs curves are reasonable. Looking at the rather poor IbIs curves for channels D1 & B2, their derived Rn (& Rp for that matter) values should not be trusted.
Excluding these two channels, the parasitic resistances Rp for all channels seem reasonable… unless looking at DIB 3. For the channels on DIB 3, the parasitic resistances are significantly higher than expected. Compared with those from phonon channels on DIBs 1 & 2, they range from a factor of 3 higher to an order of magnitude. Rp is calculated in a similar way to Rn, and as the Rn values seem reasonable for all channels on DIB 3, the code is exonerated.
It would be interesting to see if this is a problem with the DCRC Rev. C.1 board or the SQUET card. Tomorrow, the DCRCs in DIBs 2 & 3 can be swapped, and after retuning the SQUIDs some additional IbIs curves can be acquired. Before doing this, a quick measurement of the Tcs should be conducted with the tower thermometer.
| Table 1: Values derived from IbIs curves in Fig. 1. | |||||
|---|---|---|---|---|---|
| Channel | Rn [mΩ] | Rp [mΩ] | Ib at transition [±2 μA] | Ib at Rn/4 [μA] | Current Ib [μA] |
| A1 | 586 ± 1 | 10.35 ± 0.08 | -50 | -56.93 ± 0.01 | -64.5 |
| B1 | 470 ± 1 | 9.38 ± 0.05 | -54 | -68.13 ± 0.01 | -79.0 |
| C1 | 524 ± 1 | 3.92 ± 0.04 | -34 | -46.34 ± 0.01 | -59.5 |
| D1 | 701 ± 3 | 20.73 ± 0.25 | -26 | -36.74 ± 0.01 | -44.5 |
| A2 | 634 ± 1 | 7.69 ± 0.06 | -42 | -53.27 ± 0.01 | -54.0 |
| B2 | 1442 ± 43 | 14.01 ± 0.27 | -50 | -60.44 ± 0.03 | -68.3 |
| C2 | 597 ± 1 | 6.46 ± 0.06 | -56 | -69.23 ± 0.01 | -60.0 |
| D2 | 577 ± 3 | 12.98 ± 0.09 | -26 | -36.50 ± 0.01 | -43.5 |
| A3 | 509 ± 1 | 49.61 ± 0.14 | 26 | 25.33 ± 0.05 | 49.0 |
| B3 | 597 ± 2 | 72.02 ± 0.31 | 56 | 56.61 ± 0.02 | 65.5 |
| C3 | 544 ± 2 | 39.35 ± 0.11 | 18 | 28.20 ± 0.02 | 40.0 |
| D3 | 426 ± 1 | 39.01 ± 0.07 | 62 | 74.73 ± 0.01 | 90.0 |
| Figure 1: IbIs (left) & IbRs (right) curves. |
|---|
 |
 |
 |
 |
 |
 |
 |
 |
 |
 |
 |
 |