| 0655 | Mixing chamber temperature 305 mK and rising quickly, 1 K pot temperature 4.1 K, helium liquid level 0.9%. Pressure of 1 K pot 3.2 mbar, indicating that it is empty. Fortunately, looking back through the history, the mixing chamber started warming up after finishing last data series. Time for a helium transfer. |
| 0715 | Commence helium transfer. Helium liquid level 0%. |
| 0825 | Cease helium transfer. Helium liquid level 91.5%. |
| 0835 | Fill N2 cold trap full. |
| 2330 | Fill N2 cold trap full. |
| | Mixing chamber temperature started to rise at around 18:20, about 18 minutes after the start of the long flash. The mixing chamber reached a peak at 230 mK, decreasing to 160 mK before rising again. This time it hit 900 mK. Not sure as to the reasons: 1 K pot looks fine, pumps seem to be working. No signs of power cut. Worried that perhaps some mixture leaked back into dump during warm up to 300 mK this morning and hence fridge does not have as much cooling power, although the readings on P1 (0.065 mbar), G1 & G2 (both around 70 mbar) were not unusual once base temperature had been reached. Pressure in P1 is down to 0.02 mbar while G1 & G2 read around 1 bar. Turn off LEDs and wait for mixing chamber to cool again. |
| Figure 1 |
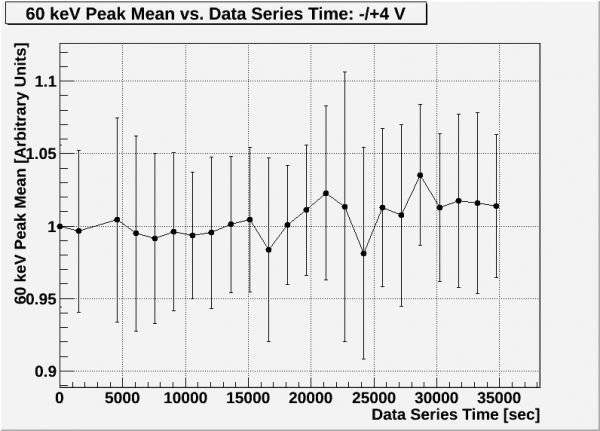 |
The figure above shows the normalized mean value of the 60 keV peak on Side 2 for the -/+4 V data taken on August 27th. Here error bars are given by the sigma value of the Gaussian fit to the peak. Plot shows a slight upward trend, though it is unknown why this is occurring.
| Figure 2 |
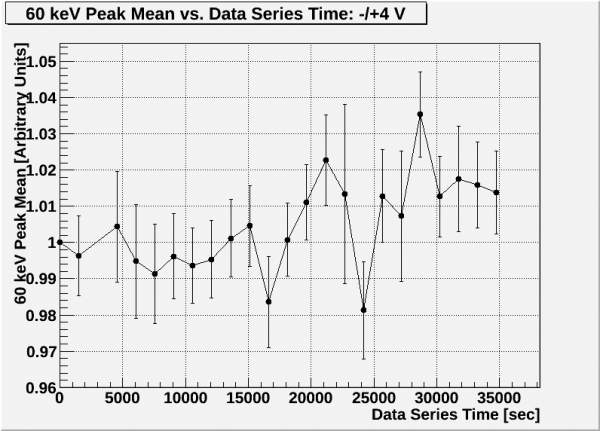 |
The figure above again shows the normalized mean value of the 60 keV peak on Side 2 for the -/+4 V data taken on August 27th. Here error bars are given by the error value of mean of the Gaussian fit to the peak.