| +/- 2.5V |
| total exposure time: 120 minutes |
| trigger on Qi channels (DIB 1 trigger threshold increased to 34 ADC bins due to noisy baseline, DIB 2 trigger threshold remains unchanged at 28 ADC bins) |
Am_241 and Pb_210 sources installed on side 2.
CUT DEFINITIONS:
thresh cut, Qsum > 0.00025 au where Qsum = Qi + Qo
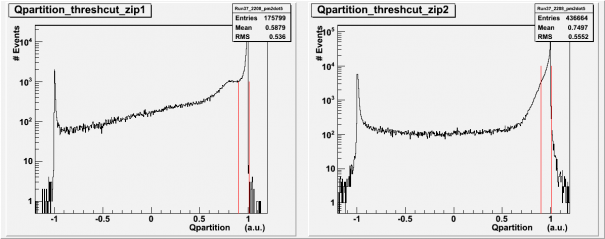
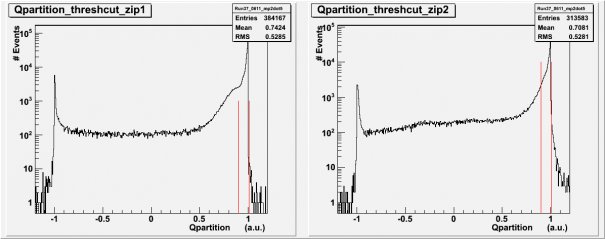
Q_partition cut, .9 < Q_partition < 1.01
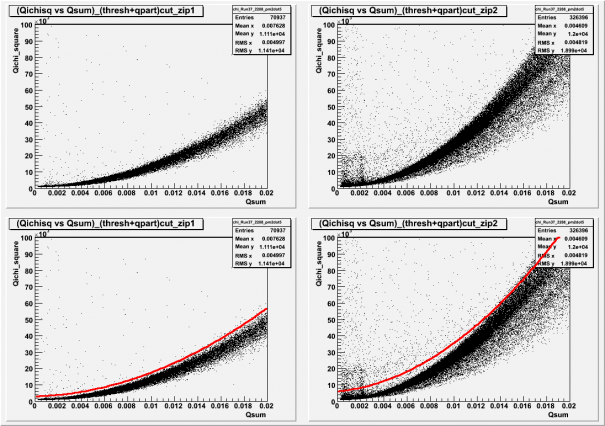
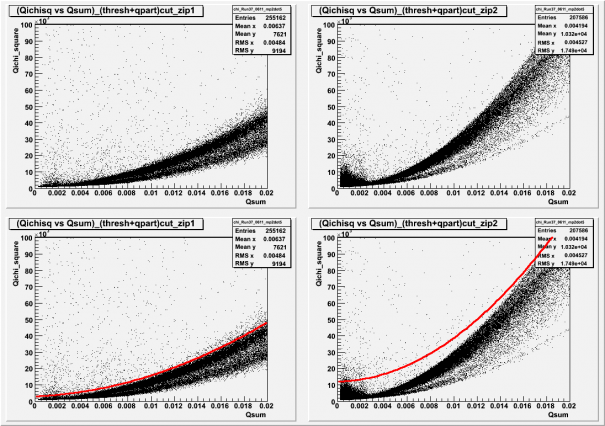
Chi_2, visual cut
| Fig. 1: Q_partition histograms for side 1 and side 2, after tresh cut. |
 |
| Fig. 2: Chi_2 histograms for side 1 and side 2, after thresh and Q_partition cuts. |
 |
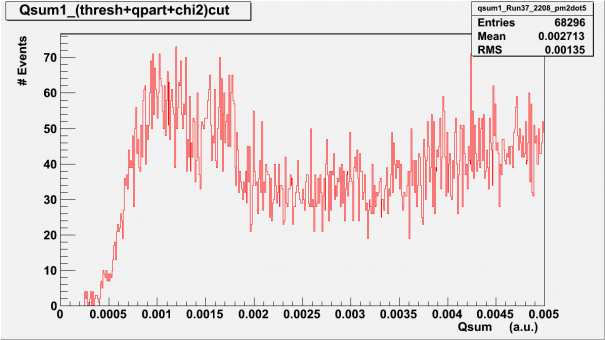
| Fig. 3: Qsum histogram, side 1, after thresh, Q_partition, and Chi_2 cuts. |
 |
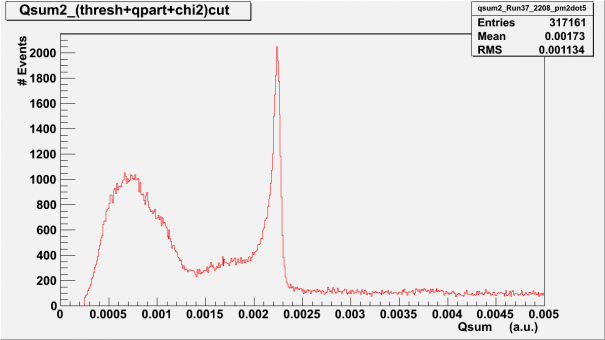
| Fig. 4: Qsum histogram, side 2, after thresh, Q_partition, and Chi_2 cuts. |
 |
| Fig. 5: Qsum 1 vs. Qsum2 histograms |
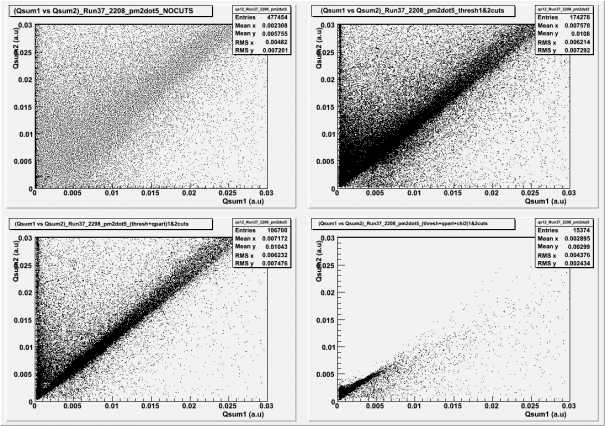 |
TOP LEFT PANEL: Qsum1 vs Qsum2, NO CUTS
TOP RIGHT PANEL: Qsum1 vs Qsum2, thresh cuts on both sides
BOTTOM LEFT PANEL: Qsum1 vs Qsum2, thresh and Q_partition cuts on both sides
BOTTOM RIGHT PANEL: Qsum1 vs Qsum2, thresh, Q_partition and Chi_2 cuts on both sides
| -/+ 2.5V |
| total exposure time: 120 minutes |
| trigger on Qi channels (DIB 1 trigger threshold increased to 34 ADC bins due to noisy baseline, DIB 2 trigger threshold remains unchanged at 28 ADC bins) |
Am_241 and Pb_210 sources installed on side 2.
CUT DEFINITIONS:
thresh cut, Qsum > 0.00025 au where Qsum = Qi + Qo
Q_partition cut, .9 < Q_partition < 1.01
Chi_2, visual cut
| Fig. 1: Q_partition histograms for side 1 and side 2, after tresh cut. |
 |
| Fig. 2: Chi_2 histograms for side 1 and side 2, after thresh and Q_partition cuts. |
 |
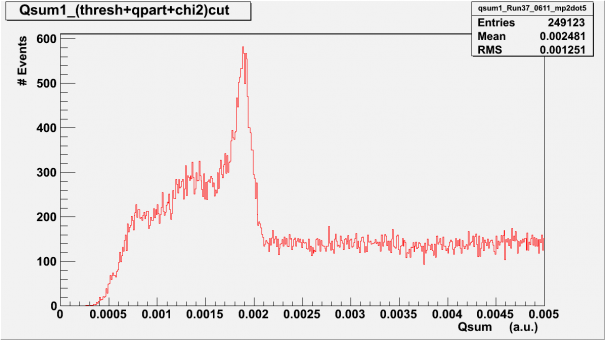
| Fig. 3: Qsum histogram, side 1, after thresh, Q_partition, and Chi_2 cuts. |
 |
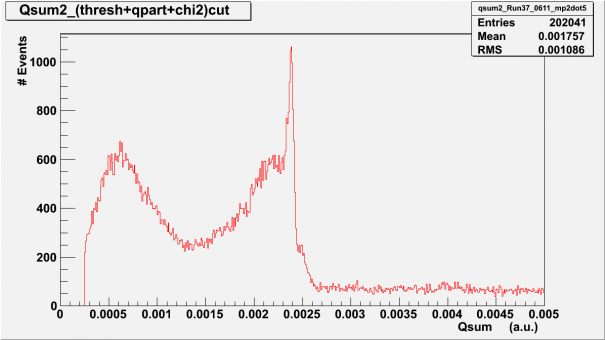
| Fig. 4: Qsum histogram, side 2, after thresh, Q_partition, and Chi_2 cuts. |
 |
| Fig. 5: Qsum 1 vs. Qsum2 histograms |
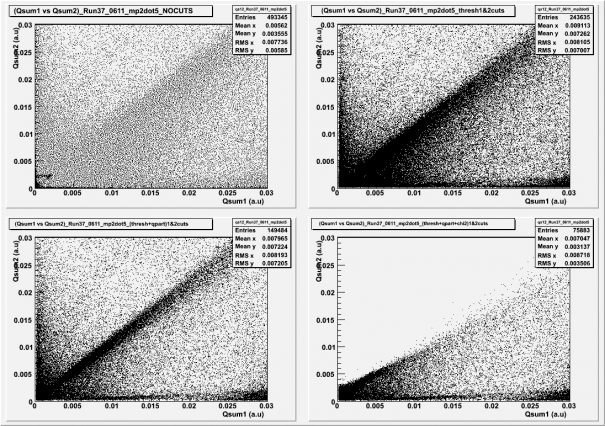 |
TOP LEFT PANEL: Qsum1 vs Qsum2, NO CUTS
TOP RIGHT PANEL: Qsum1 vs Qsum2, thresh cuts on both sides
BOTTOM LEFT PANEL: Qsum1 vs Qsum2, thresh and Q_partition cuts on both sides
BOTTOM RIGHT PANEL: Qsum1 vs Qsum2, thresh, Q_partition and Chi_2 cuts on both sides