Table of Contents
2013/03/15
Run Diary
| 0100 | LabVIEW was restarted and boards re-powered. Checked timing link- seems to be fine. |
|---|---|
| 0105 | Flash detector for one hour, cool down for 90 min. Then take fourteen 15 min series of +/- 4 V data (for Dib 1/2) with 6 seconds of flashing and 20 min of cooldown between each series. Trigger on Qi (30/35 ADC bins for Dib 1/2). |
| 0955 | Fridge seems to be running okay. Data is still being taken. |
| 1030 | Fed Cricket 4 pellets. |
| 1133 | Filled LN2 cold trap. |
| 1330 | Re-powered switch and boards. Set up timing link. |
| 1355 | Flash detector for 6 seconds, cool down for 20 min. Then take two 30 min series of +/- 6 V data (for Dib 1/2) with 6 seconds of flashing and 20 min of cooldown between each series. Trigger on Qi (30/35 ADC bins for Dib 1/2). |
| Update (2013/03/17): This data set shows similar behavior as the +/- 4 V set, even after re-powering the switch and boards. | |
| 1608 | Take three 30 min series of +/- 3 V data (for Dib 1/2) with 6 seconds of flashing and 20 min of cooldown between each series. Trigger on Qi (30/35 ADC bins for Dib 1/2). |
| 1731 | Fed Cricket 4 pellets. |
Data Analysis
+/- 4 V Data
| Preliminary look at +/- 4 V data ; 15 min./ series ; Fourteen series (first set: 07130315_0337) |
|---|
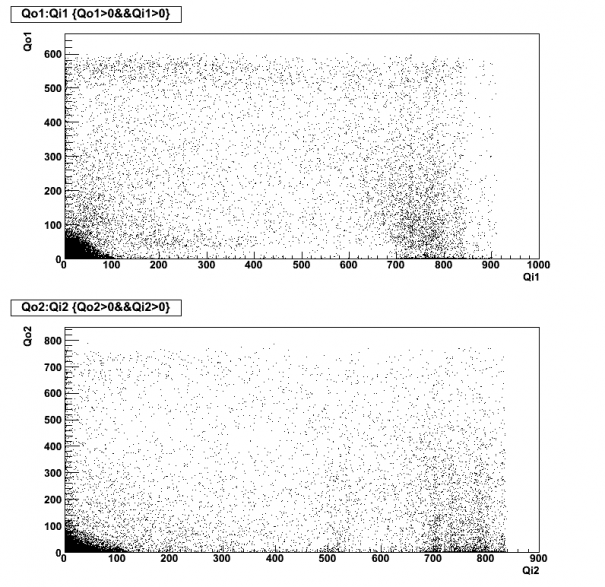
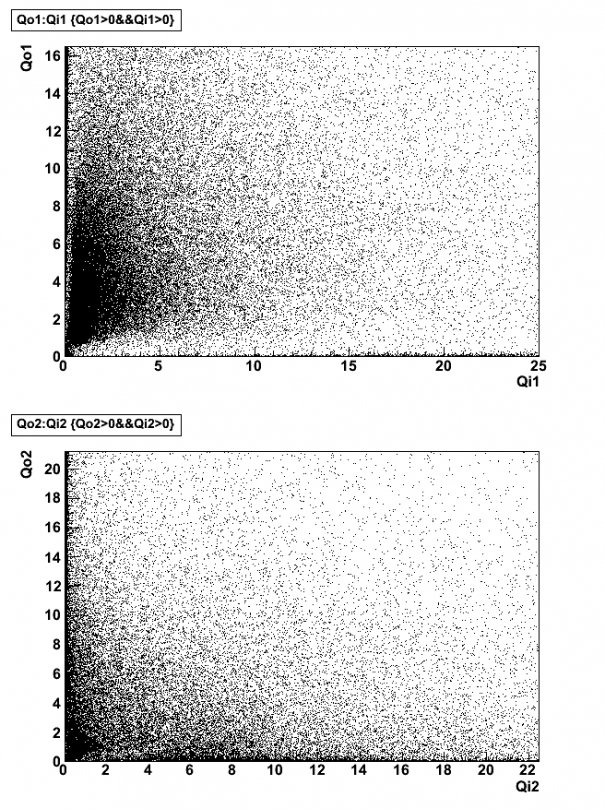
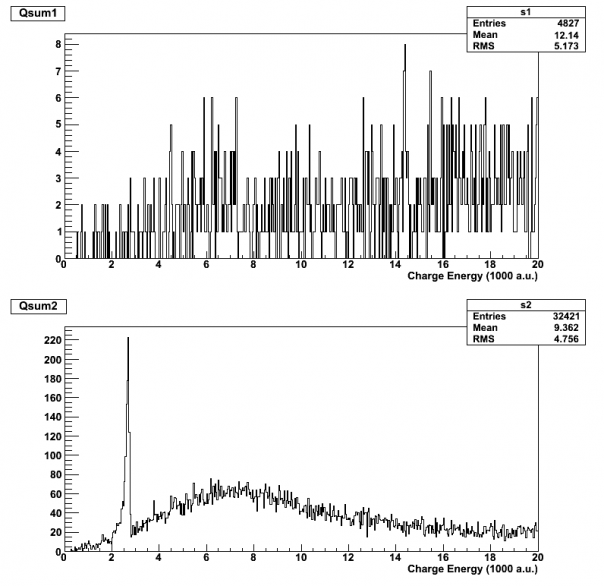
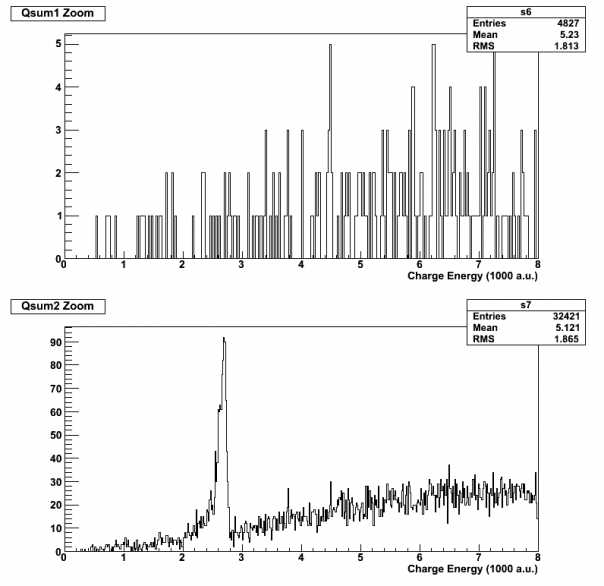
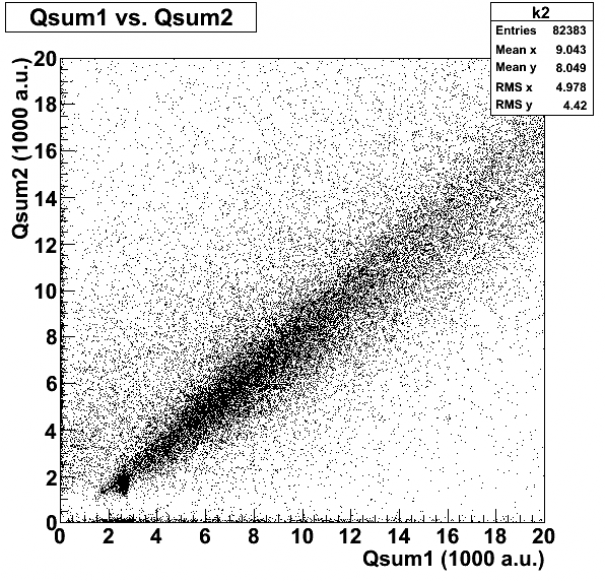
| Note these figures are uncalibrated. Units are 1000 a.u. Generally we are accustomed to seeing the 60 keV peak around 2-3 [1000 a.u.] |
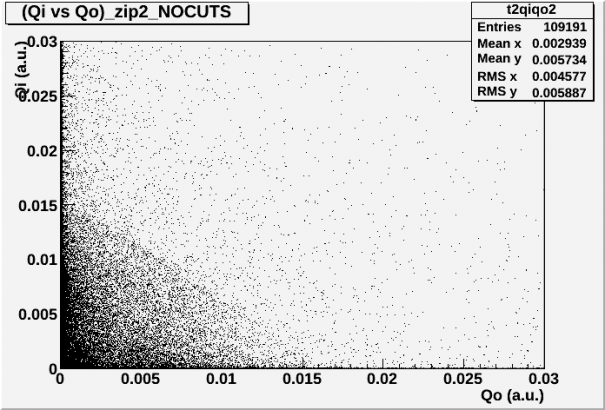
| This data again suggests that the electron-collecting side (positively-biased dib) collects a large number of low charge and Qouter events. This is puzzling considering that the Pb-210 source is only on one side of the detector. Why is this effect mostly symmetric when the polarity reverses? |
| Cuts |
|---|
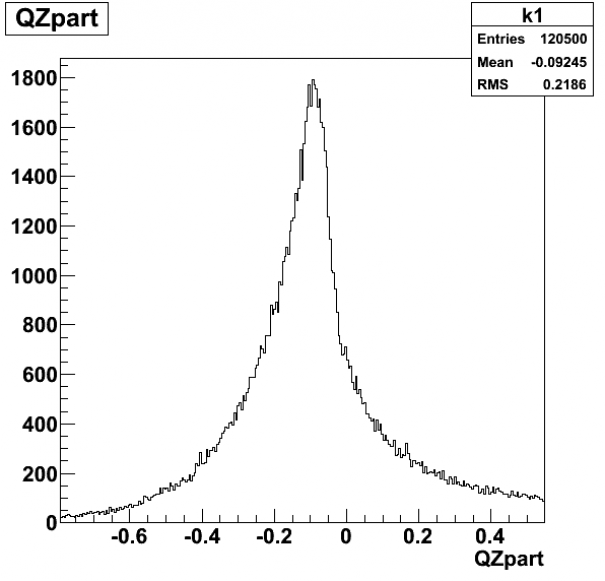
| Threshold Cut: Each individual charge channel is given a low energy cut at 0.25 [1000 a.u.] Qpart Cut: The function (Qi-Qo)/(Qi+Qo) = Qpart is limited to the range “0.9<Qpart<1” to select predominantly Qi events. Chi2 Cut: The lines for the Chi2 cut can be found on the Chi2 vs. Charge figures below. They are based off of Chi2 (for Qi) vs. Qi. When placing the cut on Qsum, the y-intercept is raised by 2000 to relax the cut at low energies. |
| Analyses Description |
|---|
| 1. The order of plots created below is the order that I conduct the analyses 2. When I create my Chi2 vs Charge cut, I implement the threshold cut to do this. To clarify, Figs. 4 and 5 below are Chi2 vs. Charge with no cuts implemented at all, but the black cut line itself is created in the Chi2 vs. Charge analyses with the threshold cut included. 3. Figs. 6 and 7 are the only plots that have cuts implemented. Both side 1 and side 2 analyses are shown, and each side has its respective Qpart and Chi2 cut applied. |
| Fig. 1: Qi vs. Qo [1000 a.u.] - No Cuts | Fig. 2: Qi vs. Qo - zoom [1000 a.u.] - No Cuts |
|---|---|
 |  |
| Fig. 3: Qpart - No Cuts |
|---|
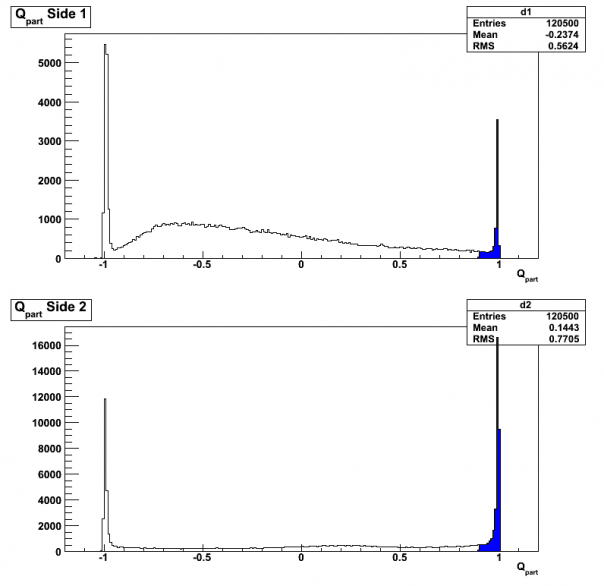 |
| The blue section shows what gets used in the Qpart cut. |
| Fig. 4: Chi2 vs. Charge (1000 a.u.) - No Cuts | Fig. 5: Chi2 vs. Charge - zoom - No Cuts |
|---|---|
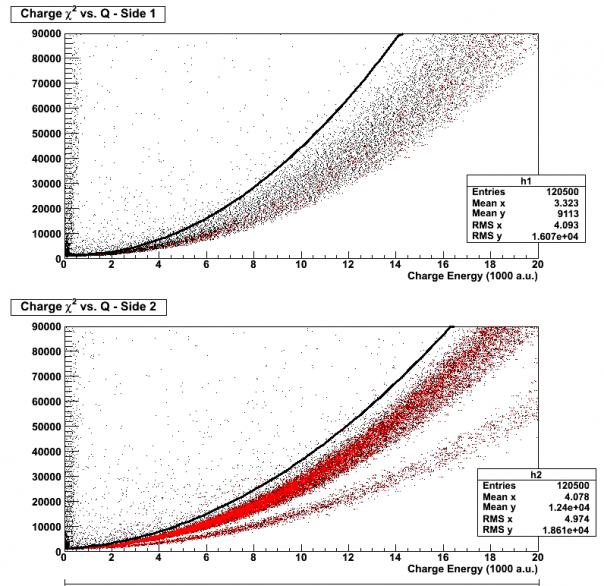 | 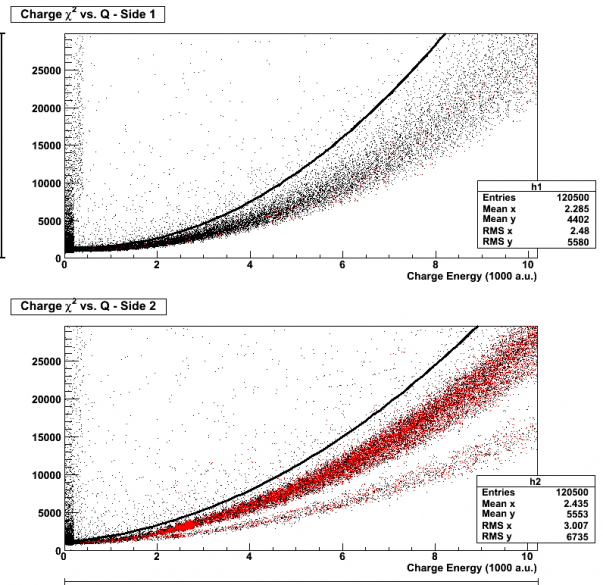 |
| The black line and red dots show what would pass the Chi2 vs. Charge cut if implemented. This cut was created when a threshold cut was implemented on the data. | |
| Fig. 6: Qsum - Threshold cut, Qpart Cut, Chi2 cut (1000 a.u.) | Fig. 7: Qsum - zoom (1000 a.u.) |
|---|---|
 |  |
| Fig. 8: Qzpart - No Cuts | Fig. 9: Qsum1 vs. Qsum2 - No Cuts |
|---|---|
 |  |
| A look at raw pulses for this data, and compare to 07121105_0621 taken in Run 32 (similar data taking settings, except smaller coincidence time - 10 us). |
|---|
+/- 3 V Data
This data was taken after the DAQ and switch were restarted. Compare to initial +/-3 V data taken on 2013/03/14
| Preliminary look at +/- 3V data with Ba/Am/Pb sources. Or Qi1/2 Trigger 30/35 ADC bins. 3 series starting with 07130315_1606, 109191 total events. |
|---|
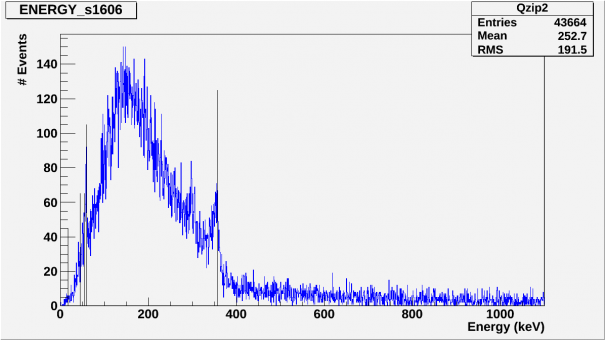
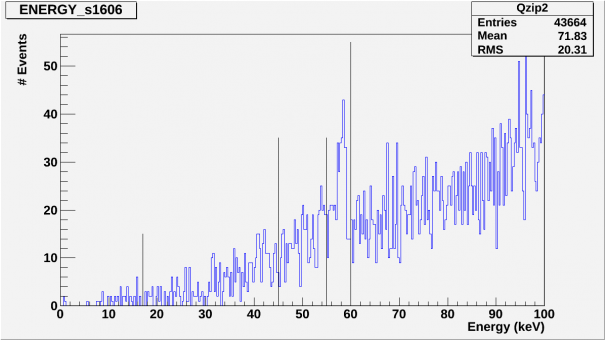
| Only the final spectra for side 2 are energy calibrated. All other charts/plots are in (a.u.) The side spectra was calibrated for the 356keV peak. Included in the spectra are also indicators for the 60kev Am-241 peak, 45-65keV Pb activity region and 17keV indicator. The scaling is not linear as can be seen by the location of the 60keV Am-241 peak to the 60keV line indicator. We were unable to retrieve statistic for side 1. |
| Cuts |
|---|
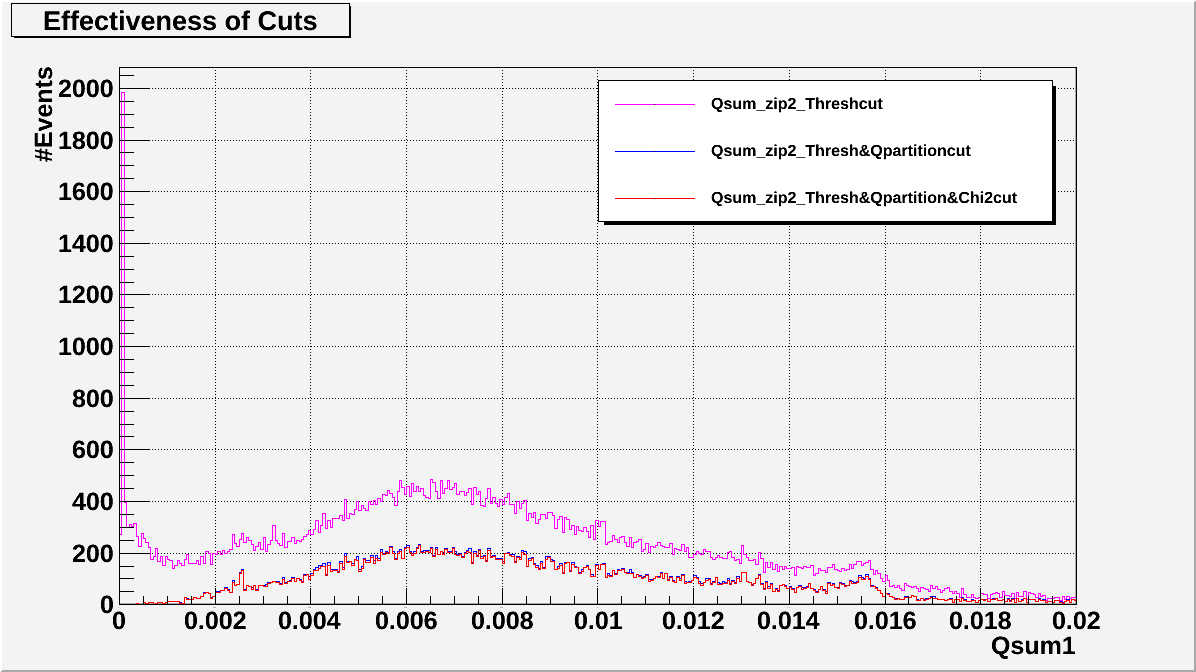
| Thresh_side = qsum_side > .000025 |
| Qpart_side = .9 < qsum_side < 1.01 |
| Chi^2cut_side = best fit above main distribution |
| Analysis Procedure |
|---|
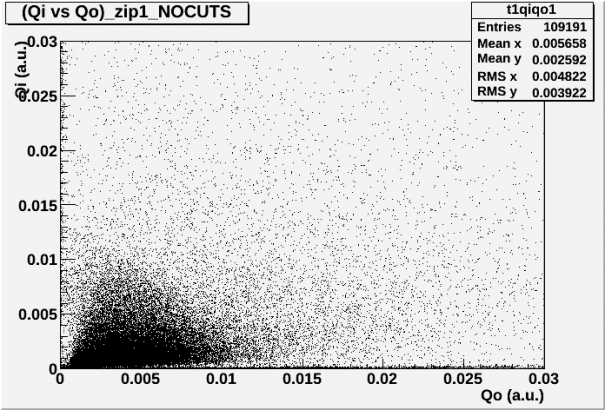
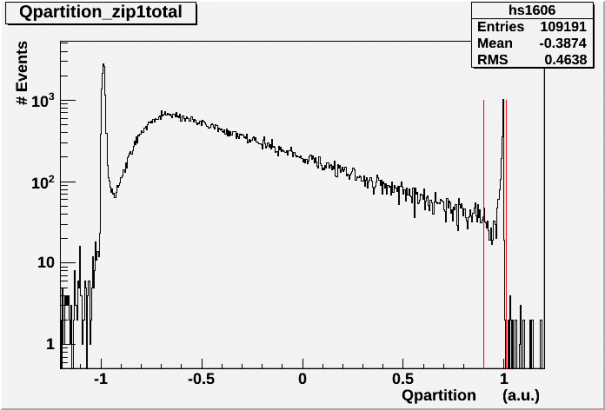
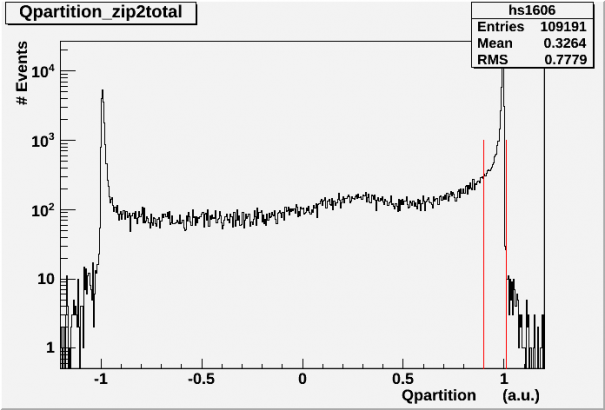
| Qi vs Qo plots and Qpartition histograms are of the full data set with no cuts implemented. |
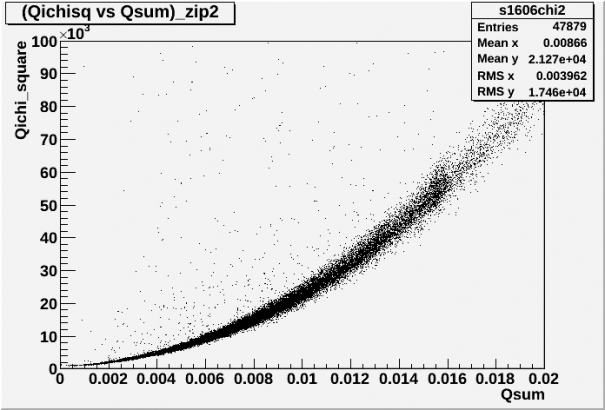
| The Chi2 vs Qsum plots are produced after implementing the Qpartition and Threshold cuts for each side. |
| The final spectra are of the final data sets for each side after implementing all 3 cuts. |
| No discernible features were present on the side 1 spectra, the units are Qsum(a.u.) |
| Side 2 spectra was fitted to the 356keV Ba peak and then linearly scaled for Energy(keV) units. |
| Fig1. (Qi vs Qo)_side1_nocuts | Fig2. (Qi vs Qo)_side2_nocuts |
|---|---|
 |  |
| Fig3. Q_Part_1_nocuts | Fig.4 Q_Part_2_nocuts |
|---|---|
| The red lines denote the Q_partition cut parameters. | The red lines denote the Q_partition cut parameters. |
 |  |
| Fig5. (Chi2 vs Qsum)_side 1 | Fig6. (Chi2 vs Qsum)_side2 |
|---|---|
| Data set has been cut with the Q_partition cut and Threshold cut | Data set has been cut with the Q_partition cut and Threshold cut |
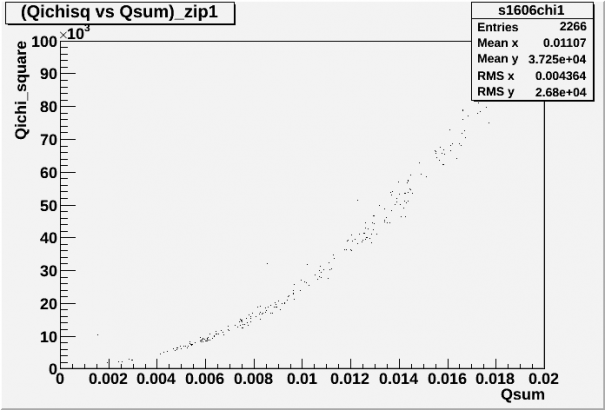 |  |
| As you can see, we have already eliminated over 90% of our data for side 1. |
| Fig7. Qsum_side1 histogram, full range | Fig8. Qsum_side1 histogram, zoomed in |
|---|---|
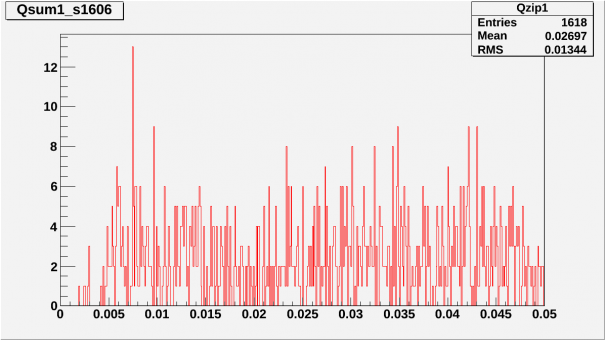 | 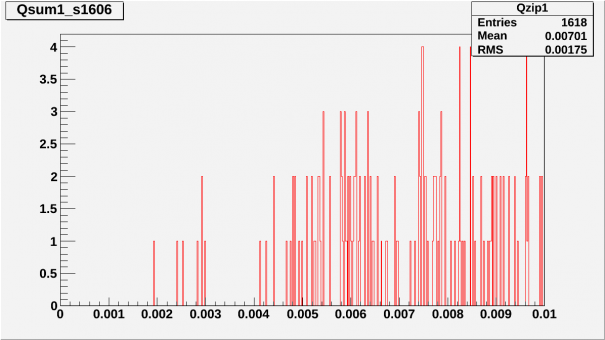 |
| no clear spectral feature is present | no clear spectral feature is present |
| Fig9. Energy spectrum, zip2 full range | Fig10. Energy spectrum, zip 2 <100keV |
|---|---|
 |  |
| Effectiveness of cuts for side 2 |
|---|
 |
Trigger Investigation
A comparison of statistics from Run28(G101b)_+/-3V and Run36(G101b)_+/3V
| Run28 (G101b)_+/-3V vs. Run36 (G101b)_+/-3V |
|---|
| The data used for the Qzpart histograms associated with Run28(G101b)_ +/-3V were obtained by chaining the series starting with 07120518_0947 |
| Sources used: Am-241, Ba-133 |
| The data was collected with a 0.4096ms trace length; 100 us delay; Trigger 40 ADC bins all Q; data/flashing/cooldown = 50/0.1/20 min |
| Total exposure time: 200 minutes |
| Frequency of triggers: f = (total events/total exposure time) = 30 Hz |
| (Deadtime/Event) = (1/f) - (trace+delay) = 33.3ms - 0.5096ms = 32.7904ms |
| The data used for the Qzpart histograms associated with Run36(G101b)_ +/-3V were obtained by chaining the series starting with 07130315_1606. |
| Sources used: Pb, Am-241, Ba-133 |
| The data was collected with a 0.4096ms trace length; 100 us delay; OR trigger on Qi channels (30/35 ADC bins for Dib1/2); data/flashing/cooldown = 30/0.1/20 mins. |
| Total exposure time:(total events/total exposure time)= 90 minutes |
| Frequency of triggers: f = (total events/total exposure time) = 20.18 Hz |
| (Deadtime/Event) = (1/f) - (trace+delay) = 49.5ms - 0.5096ms = 48.9906ms |
| Discussion |
|---|
| It is puzzling that we are triggering at ~20Hz in Run36 when during run28 we were triggering at 30Hz. This is quite troublesome especially when we consider that during run28 we were using a 40adc AND allQ trigger which should have a statistically lower event rate than the 30/35 OR Qi1/Qi2 trigger used in the acquisition of the run36 data set. This becomes even more puzzling because Pb(10tps) + Am(20tps) should produce an event rate of about 30Hz without any background triggers. From the Run26 data, it looks as though background adds about 10Hz at +/-3V, so my expectation for Run36 is an event rate around 40Hz but we are observing an event rate of 20.18Hz. This 40Hz sampling rate would produce a (Deadtime/Event) = (1/f) - (trace+delay) = 25ms - 0.5096ms = 24.4904ms. I have made some inquiries into whether or not this exceeds the processing time for a single event but I wasn't able to find a clear answer on this issue. |
| Fig.1 QzPart_NOCUTS_RUN28_0947 | Fig.2 QzPart_NOCUTS_RUN36_1606 |
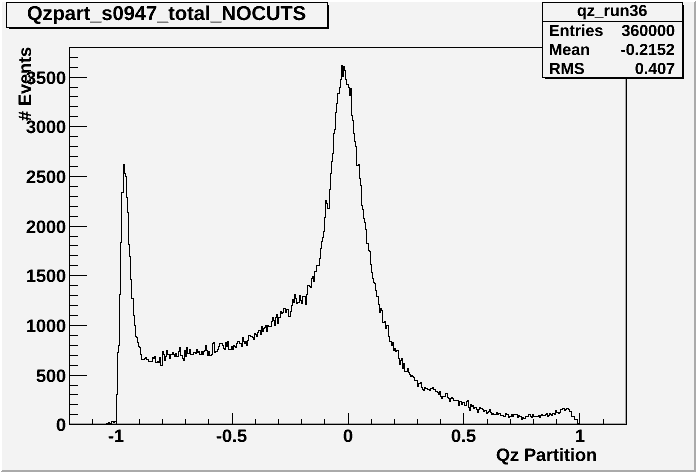 | 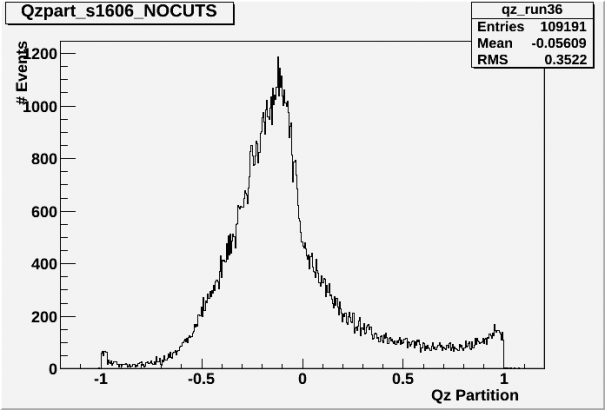 |
| We see in the above histograms the reverse symmetry domination on Side2 vs Side1 for the two different runs. It is worth noting that the integral from .5 - 1 of the two distributions is similar if adjusted by an exposure parameter a=90/200=4.5. This indicates that we are collecting well on side2 for this bias but we are not collecting well on side1. However, we noticed the same difficulties when switching polarities so this is not an error that is associated with the particular dib, but rather with the overall efficiency of charge collection. |
| Fig.3 QzPart_all_cuts_RUN28_0947 | Fig.4 QzPart_all_cuts_RUN36_1606 |
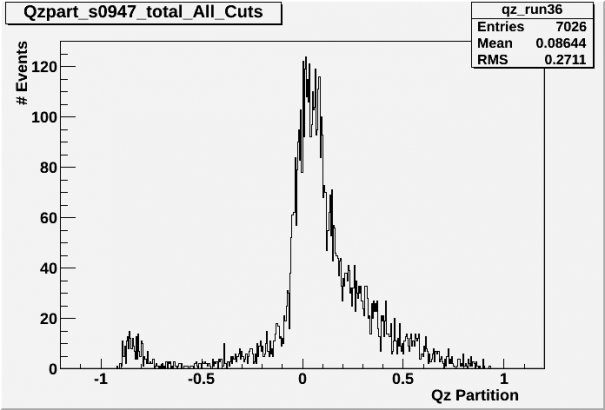 | 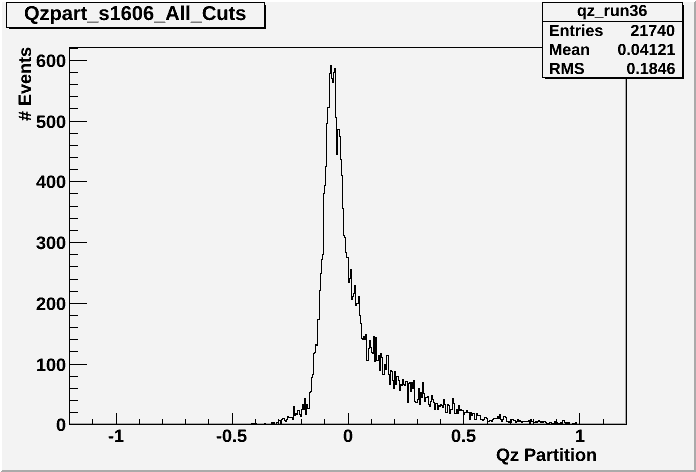 |
| The above histograms denote the QzPart quantity for each respective data set. We can see the lack of statistics for dib1/Run36, just as we expected after performing the original analysis. I suggest that once we finalize our lowest adc threshold for our current dib/DCRC combination and we determine our final bias voltage, we spend an hour and take the following data sets: |
| – Qi1 only trigger, 5minute(collection)/.1min(flashingLED)/20min(cooldown) – |
| – Qi2 only trigger, 5minute(collection)/.1min(flashingLED)/20min(cooldown) – |
| The reasoning for these two exposures is not to retrieve any meaningful spectral information but rather to investigate the frequency of trigger events. I anticipate that that Qi2 will have a much higher frequency, which is to be expected considering it is source side but it would be advisable to have a good approximation for Qi1 trigger frequency in order to ensure that we have enough exposure time to resolve spectral feature/s on side 1, which is our ultimate goal. |
| In order to ensure that we are doing all that we can to get all side information in this run, I propose that we calibrate our exposure time so that we take around 360000 events while using a Qi1&&Qi2 only trigger. We are investigating the lowest adc thresholds so that we can resolve in the low energy region and the above measurements will give us a meaningful statistic for determining how long our exposure time should be. |
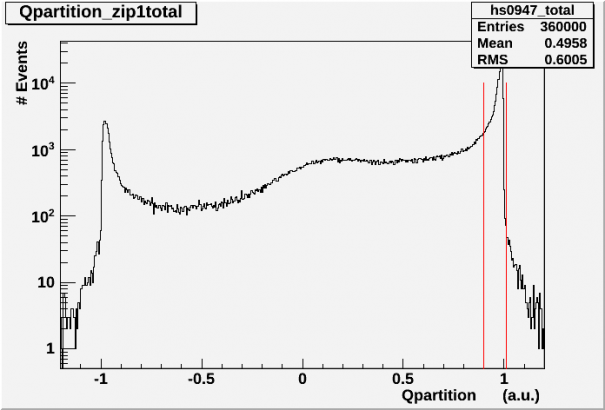
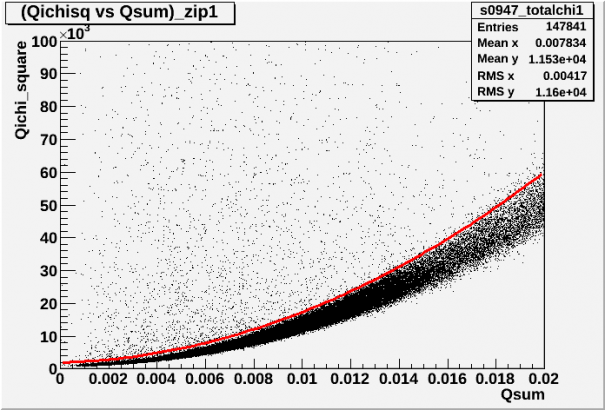
| Run28(G101b)_(+/-)_3V 07120518_0947 Plots |
|---|
| Fig.5 Qpartition_Side1 | Fig.6 Chi2 vs Qsum1, with fit |
 |  |
| Fig.7 Qsum1 Spectrum |
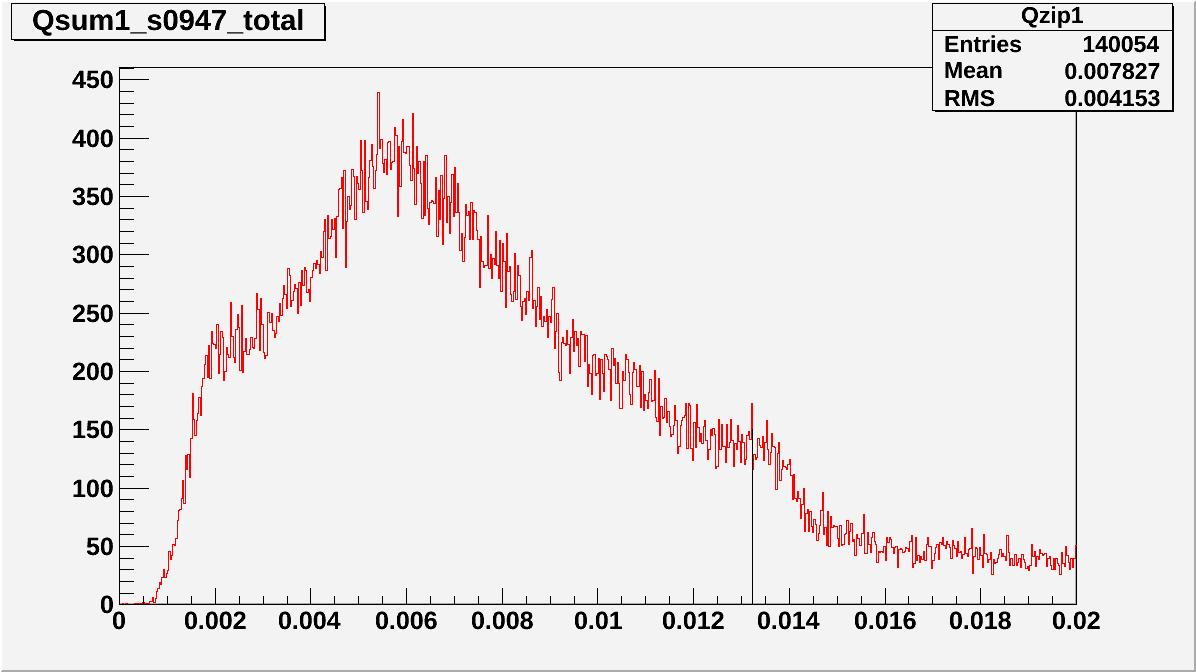 |
| The 356 peak is not very strong with a total collection of 360'000 but it is visible. |
| Fig.8 Qsum1 vs. Qsum2 |
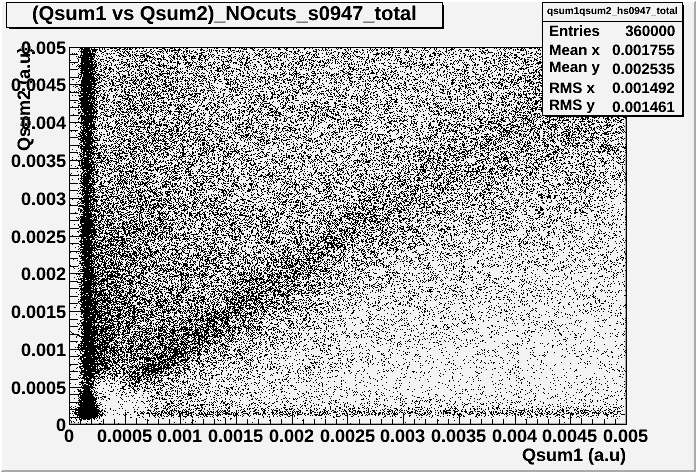 |
| Unfortunately we still observe the missing low energy box below 30keV {Qsum1, Qsum2} |
| The only good news is that it's not a data reduction issue since 2 different reduction algorithms were used. Further investigation into our filtering algorithm is required. |