2013/03/12
| 1057 | Fed Cricket 4 pellets. |
|---|---|
| 1105 | Filled LN2 cold trap full. |
| 1332 | Flash detector for 2 hours. Cool down for 1 hours. Take six 5-minute series with Dib 1/2 at +/-6, 4, and 2 V, and then another six 5-minute series with Dib 1/2 at -/+ 6, 4, and 2 V. Between each series there is 6 seconds of flashing, followed by 20 minutes of cool down. |
| 1816 | It seems around 1740 that the pressures in G1 and G2 started rising without lowering, and the base temperature is decreasing continuously. We have a blockage. The 5th data file is about to be taken. Perhaps we should wait until it's done to stop the circulation and clean the cold traps. |
| 1830 | Closed gate and condenser valves. |
| Closed V13A, opened V5. | |
| 1833 | Opened V12B. |
| 1836 | Fed Cricket 4 pellets. |
| 1949 | Closed all valves on left hand side of IGH. |
| 2100 | Lost track of time so the time stamp isn't correct… stopped 1K pot and stopped He recovery. |
| Pulled out He cold trap and began pumping on it. | |
| Pulled out N2 cold traps. As they warmed, began pumping on them. |
Today we attempted to take data at 6 V, 4 V, and 2 V biases, six 5-minute series at each bias. However, the cold traps required cleaning and therefore we had to cut the first bias set, +/- 6 V for Dib 1/2, short by one series and none of the other biases had data taken at them. It was noted right away that only 2 files were taken per series, and each file consisted of 2000 events - this event rate seems unusually low.
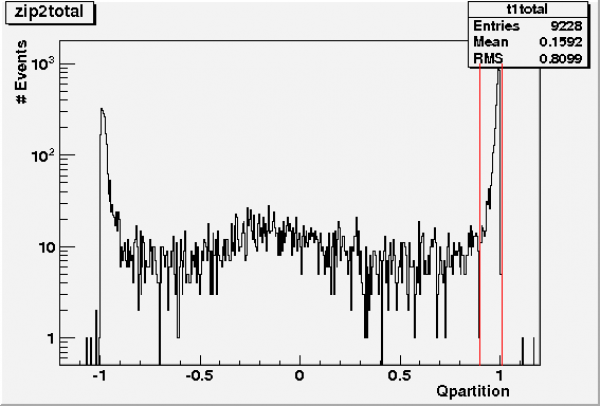
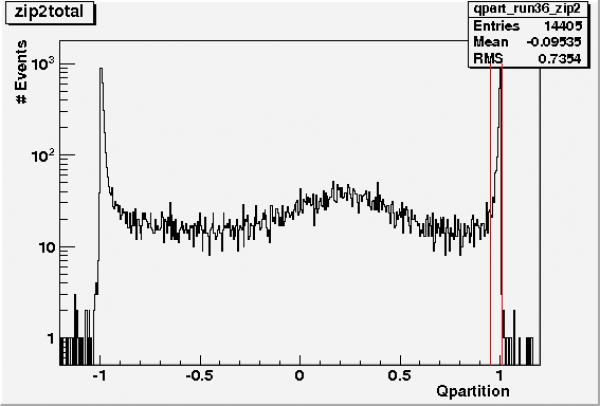
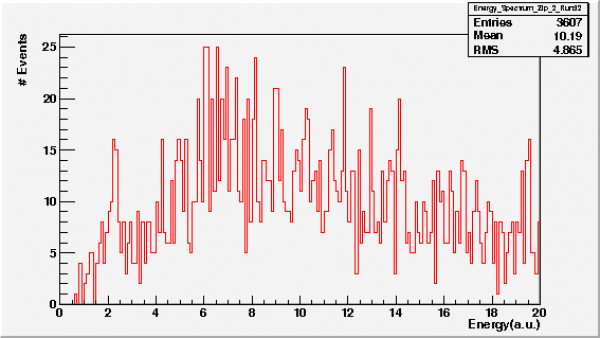
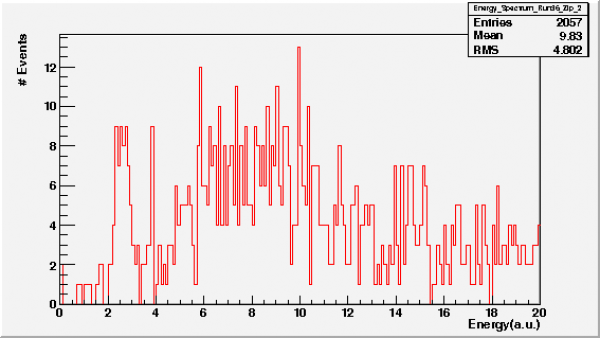
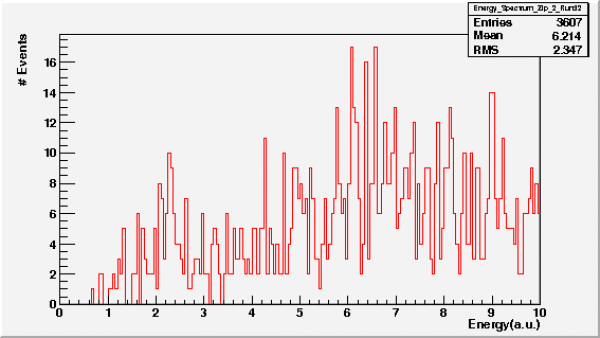
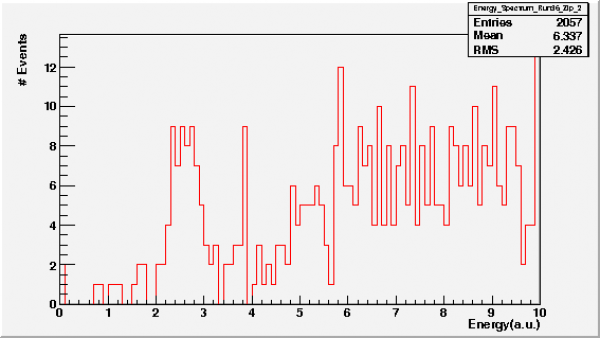
We made a comparison below between Am-241 data in Run 32 and Am-241/Pb-210 data in Run 36. We can redo this comparison with a different data set - this Run 32's data set was phonon data at +/- 3 V. perhaps an Am-241-only run close to +/- 6 V in bias, and we can make a timing cut to scale down the number of events to compare to this. See G106a data. In any case, the goal was just to make a quick point that in this Run 36 data set we do believe we are seeing the 60 keV peak from Am-241 and the 40 keV peak from Pb-210. The spectrum in the run 36 data set is slightly shifted to higher values than in normal Am-241 data set- note in Figure 1 and 2 the difference in the position of the bump near 0. We believe that the 60 keV peak in the run 36 data set will be at a slightly higher value than 2 or 3 (1000 a.u.). A look at the spectra from run 32 and 36 in Figure 3 and 4, as well as the zoomed figures 5 and 6, show a standard 60 keV peak from run 32 and a Pb-210 40 keV peak next to a sharp 60 keV peak. Note the broadness of the 40 keV.
The run 32 data shown below has only 2 data sets with 5 minutes of data each. The run 36 data has 5 data sets with 5 minutes of data each. However, it is obvious that there aren't a lot of statistics in the latter data set. We need to increase this to make effective studies of this detector with the Pb-210 source.
| Run 32 Analysis (+/- 3 V) | Run 36 Analysis (+/- 6 V) |
|---|---|
| Figure 1: Qpart, Zip 2 (no cuts) | Figure 2: Qpart, Zip 2 (no cuts) |
 |  |
| Figure 3: Qsum, Zip 2 (0.9<Qpart<1.01)) | Figure 4: Qsum, Zip 2 (0.95<Qpart<1.01)) |
 |  |
| Figure 5: Zoom Qsum, Zip 2 (0.9<Qpart<1.01)) | Figure 6: Zoom on Qsum, Zip 2 (0.95<Qpart<1.01)) |
 |  |