2012/11/17
| 0045 | Completed analysis of IbIs measurements: |
|---|
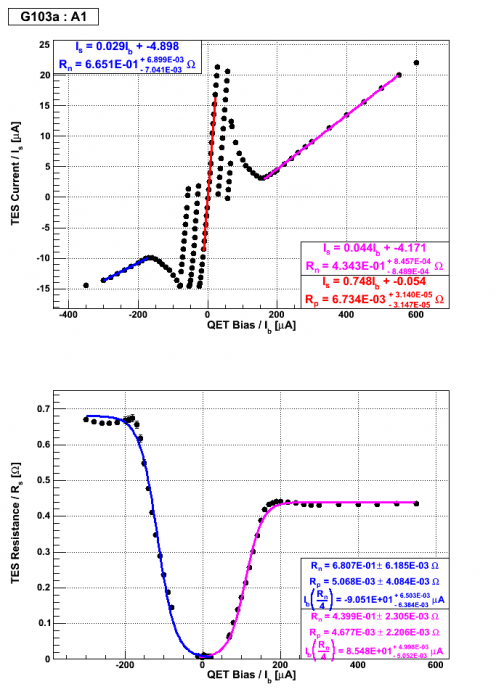
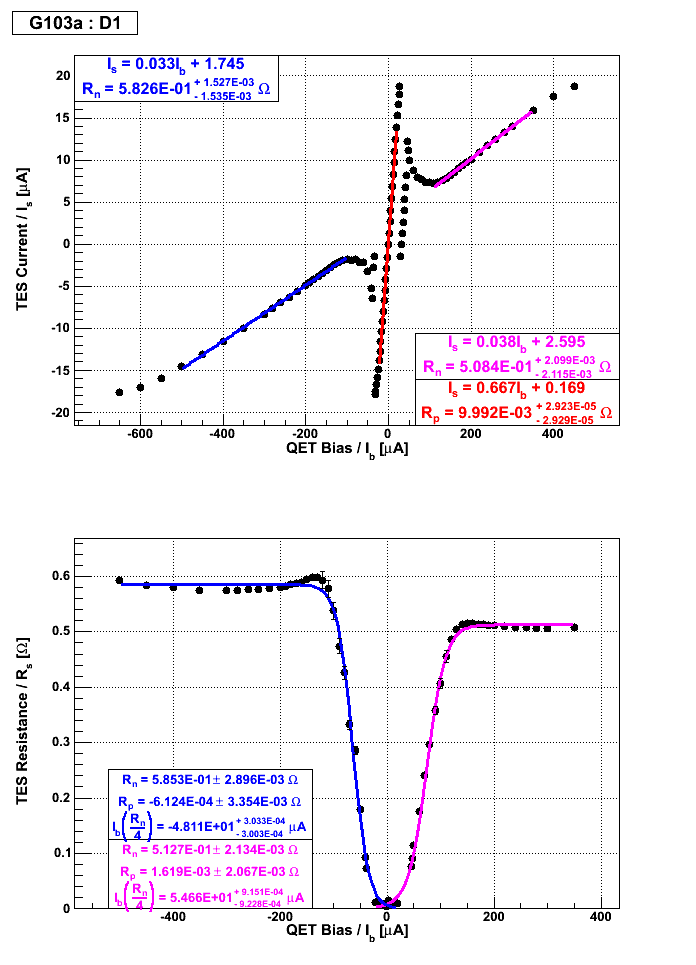
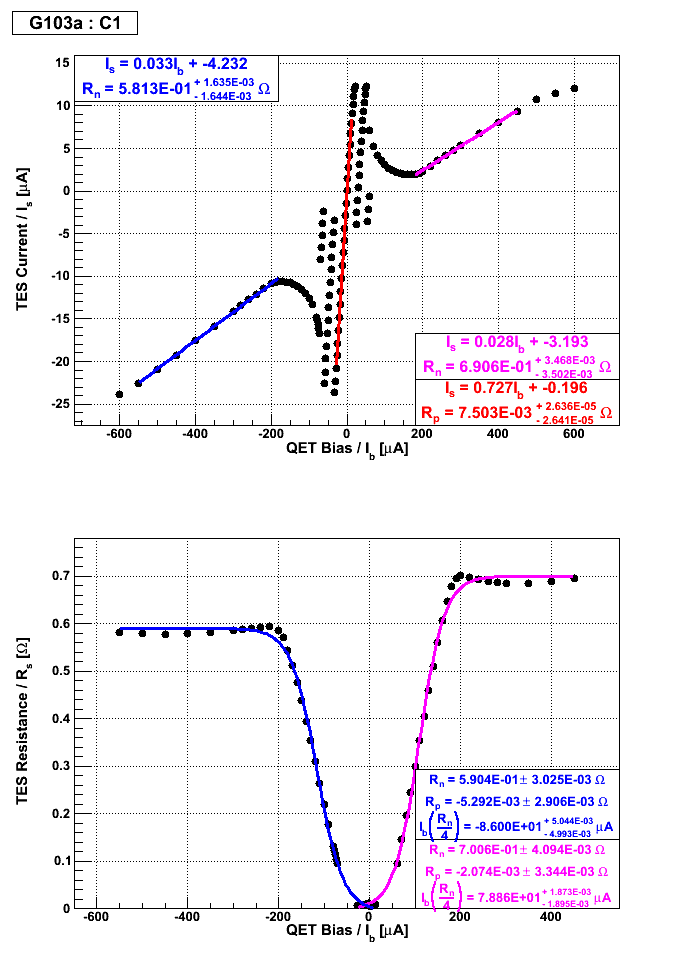
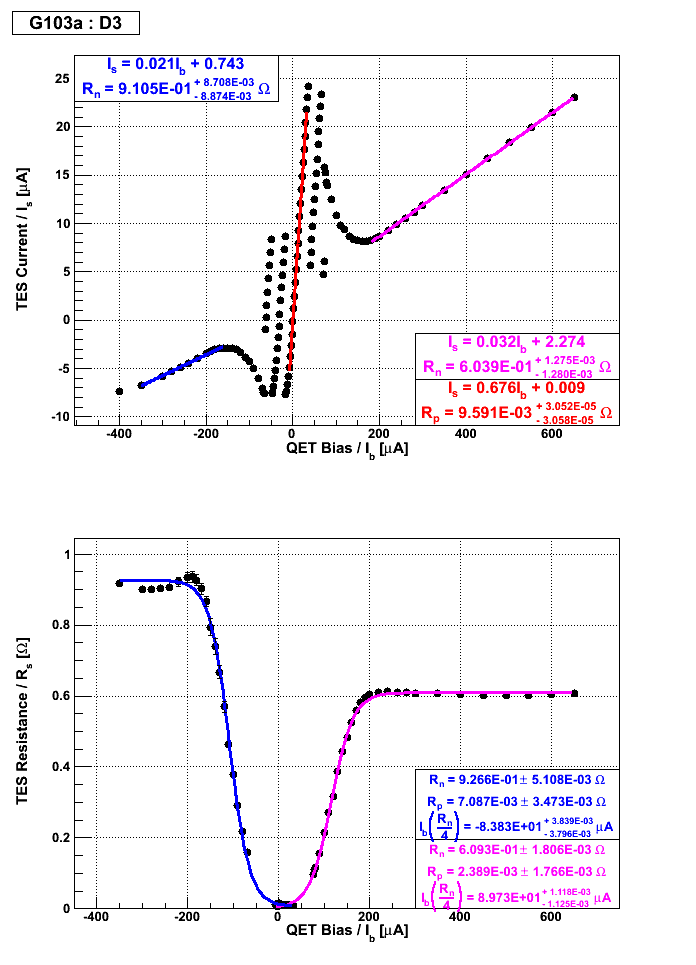
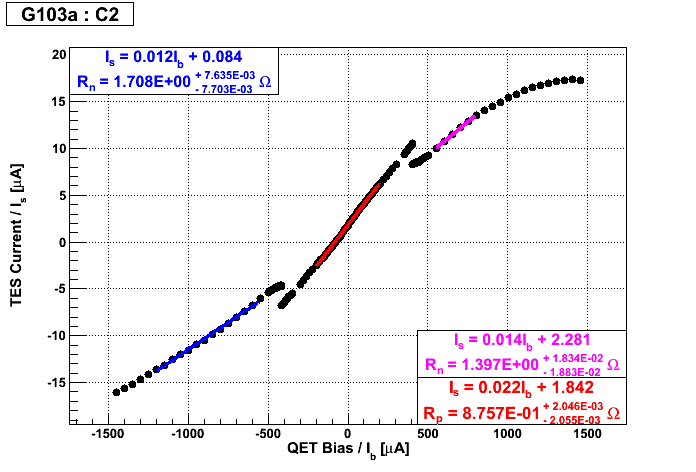
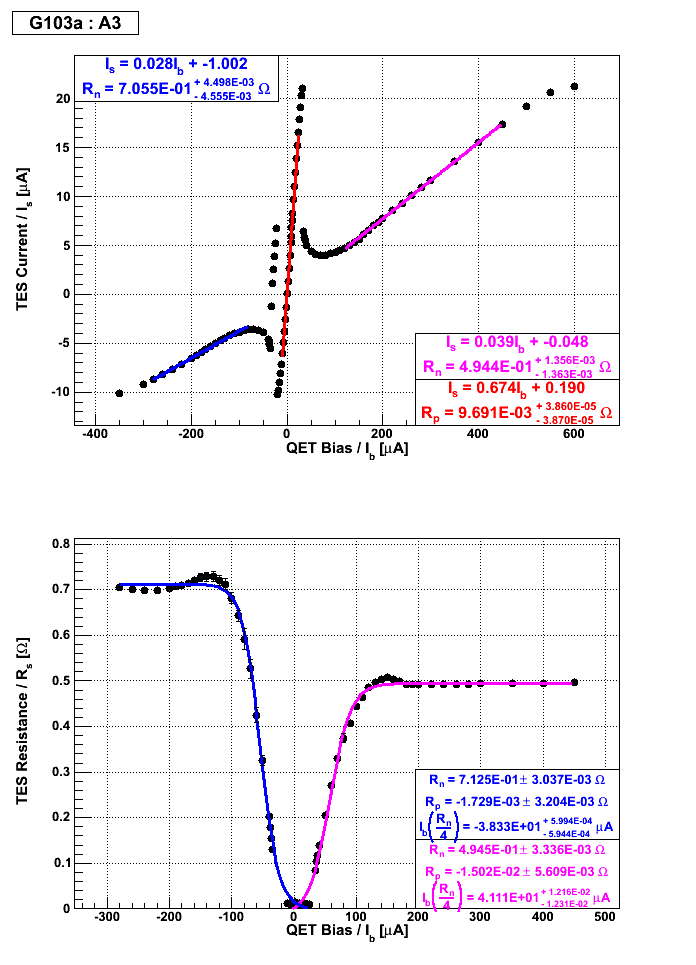
| Figure 1: Side 1 and Side 2 IbIs measurements for inner quadrant channels. | |
|---|---|
| Side 1 | Side 2 |
 |  |
 |  |
 |  |
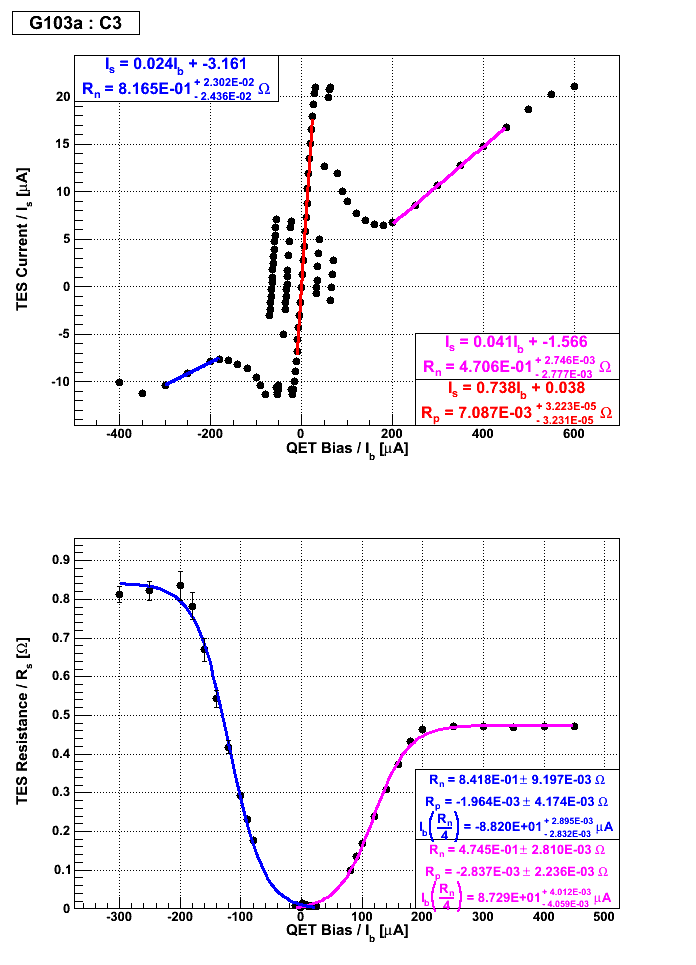 | 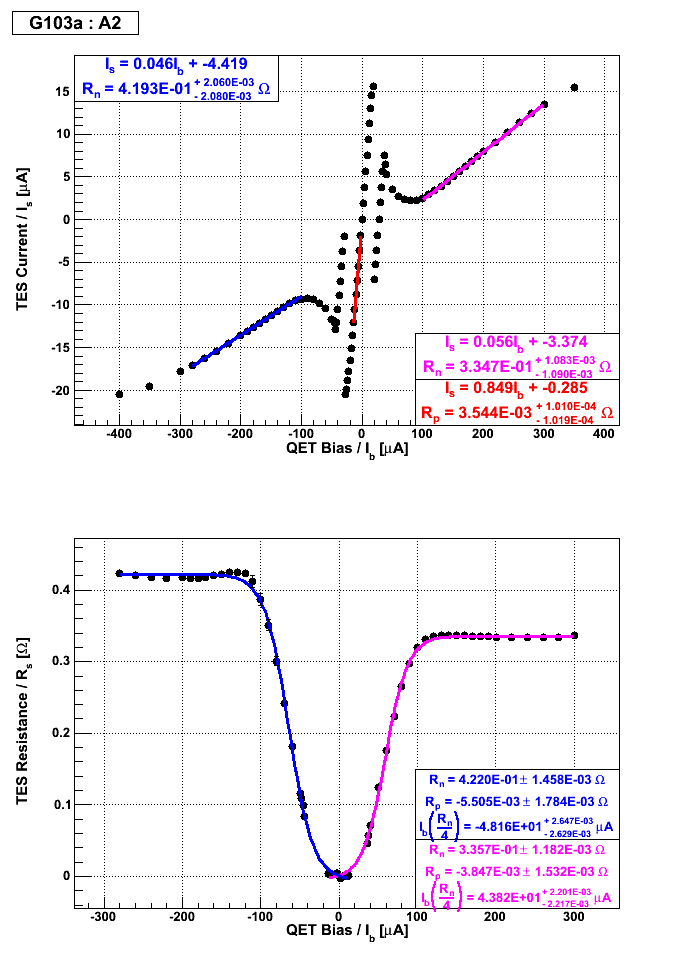 |
| Figure 2: Side 1 and Side 2 IbIs measurements for inner circle channels. | |
|---|---|
| Side 1 | Side 2 |
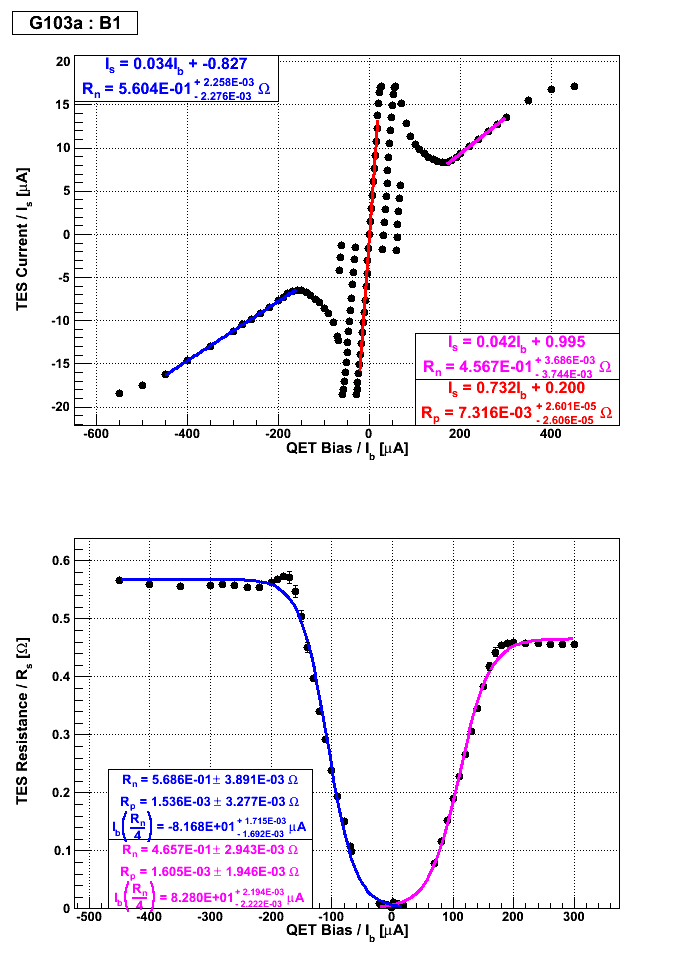 | 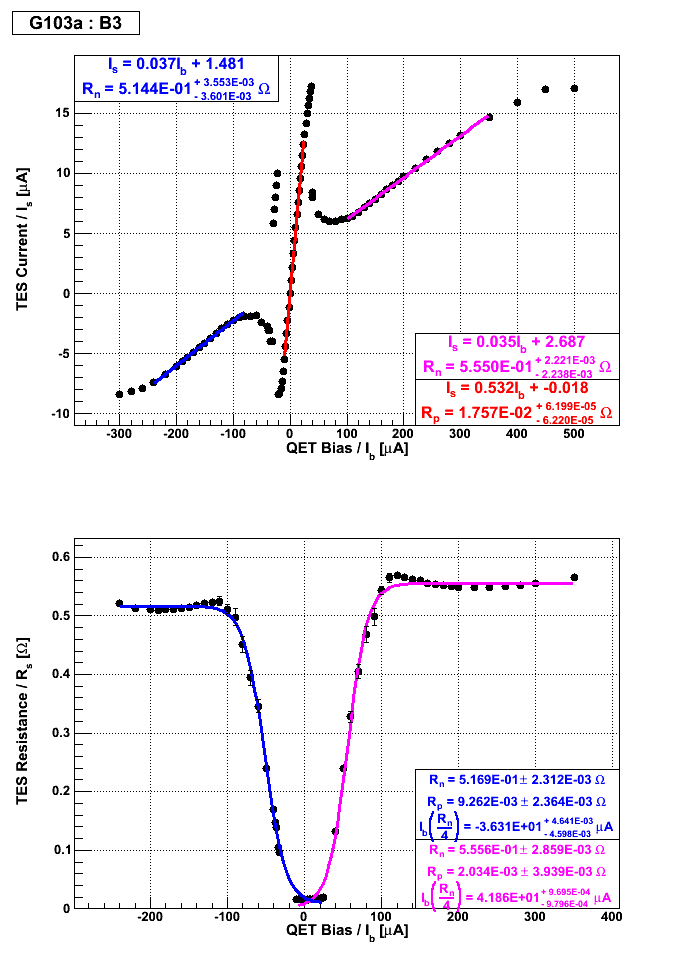 |
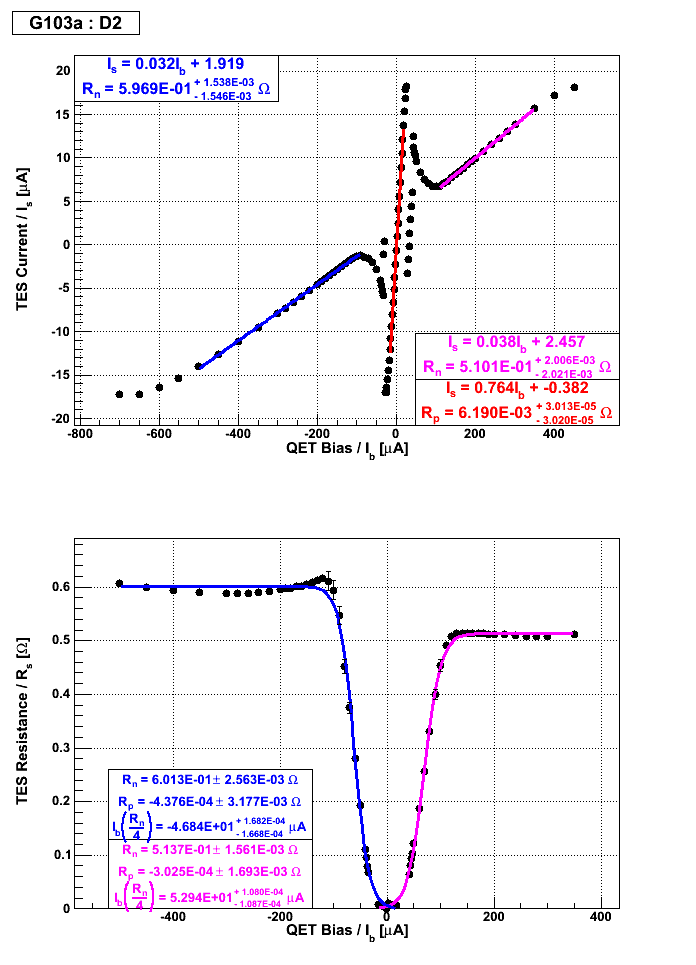
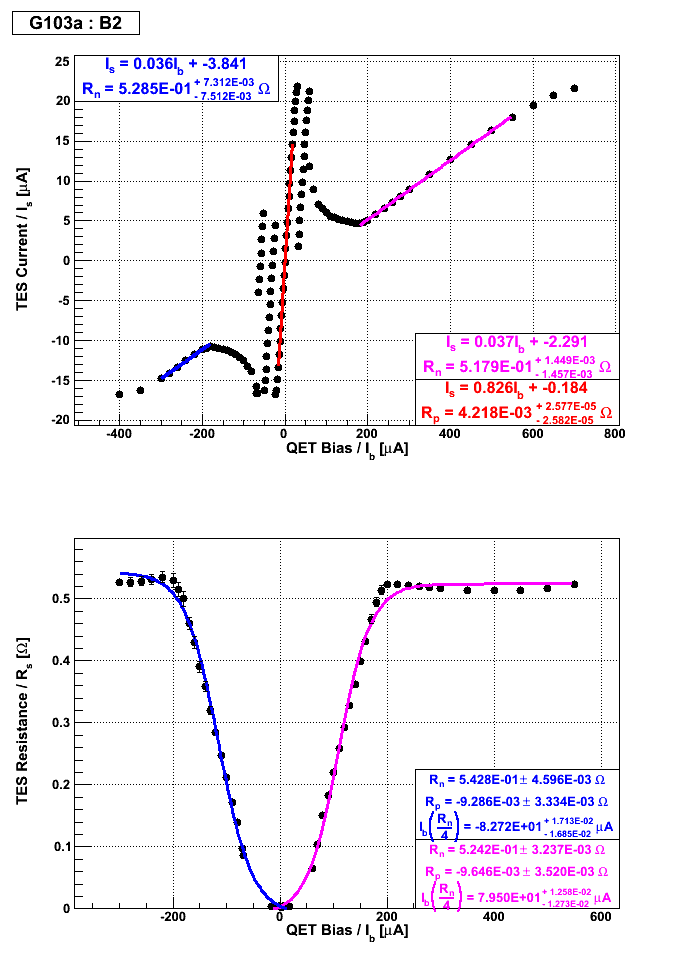
| Figure 3: Side 1 and Side 2 IbIs measurements for outer ring channels. | |
|---|---|
| Side 1 | Side 2 |
 |  |
| Table 1: Table of Parameters Derived from IbIs Measurements (error not quoted - please refer to plots above for uncertainties). | |||||||
|---|---|---|---|---|---|---|---|
| Side 1 | |||||||
| Channel | Rn [mΩ] | Rp [mΩ] | QET bias (where Rs = Rn/4) [μA] | Previous QET bias [μA] | |||
| A1 | 675 | 434 | 681 | 440 | 6.7 | -90.5 | -95 |
| C1 | 581 | 691 | 590 | 701 | 7.5 | -86.0 | -88 |
| C2 | 1710 | 1400 | - | - | 880 | - | - |
| C3 | 817 | 471 | 842 | 475 | 7.1 | -88.2 | -92 |
| B1 | 560 | 457 | 569 | 466 | 7.3 | -81.7 | -85 |
| D2 | 597 | 510 | 601 | 514 | 6.2 | -46.8 | -45 |
| Side 2 | |||||||
| Channel | Rn [mΩ] | Rp [mΩ] | QET bias (where Rs = Rn/4) [μA] | Previous QET bias [μA] | |||
| D1 | 583 | 508 | 585 | 513 | 10.0 | -48.1 | -45 |
| D3 | 911 | 604 | 927 | 609 | 9.6 | -83.8 | -80 |
| A3 | 796 | 494 | 713 | 495 | 9.7 | -38.3 | -44 |
| A2 | 419 | 335 | 442 | 336 | 3.5 | -48.2 | -49 |
| B3 | 514 | 555 | 517 | 556 | 17.6 | -36.3 | -35 |
| B2 | 526 | 518 | 543 | 524 | 4.2 | -82.7 | -70 |
| 0815 | Fill N2 cold trap full. |
|---|---|
| 0920 | Final SQUID assignments: |
| Table 2: Final SQUID assignments. | |||||
|---|---|---|---|---|---|
| DIB 1 | |||||
| Channel | Driver Offset [V] | Polarity | SQUID bias [uA] | Lockpoint [mV] | QET bias [uA] |
| A | 0.6 | non-inverting | 100.0 | 5.25 | -90.4 |
| B | 0.6 | non-inverting | 93.10 | 1.51 | -81.7 |
| C | 0.0 | inverting | 96.03 | 6.36 | -85.9 |
| D | 0.0 | non-inverting | 95.02 | 5.20 | -48.1 |
| DIB 2 | |||||
| Channel | Driver Offset [V] | Polarity | SQUID bias [uA] | Lockpoint [mV] | QET bias [uA] |
| A | 0.0 | non-inverting | 68.00 | 5.74 | -48.1 |
| B | 0.0 | inverting | 94.03 | 3.60 | -82.7 |
| C | 0.0 | non-inverting | 97.03 | 5.74 | -440.0 |
| D | 0.0 | non-inverting | 95.02 | -5.50 | -46.9 |
| DIB 3 | |||||
| Channel | Driver Offset [V] | Polarity | SQUID bias [uA] | Lockpoint [mV] | QET bias [uA] |
| A | 0.0 | non-inverting | 85.00 | 4.57 | -38.2 |
| B | 0.0 | inverting | 68.37 | 3.60 | -36.2 |
| C | 0.0 | non-inverting | 82.01 | 4.70 | -88.3 |
| D | 0.0 | non-inverting | 85.00 | 3.50 | -83.7 |
| 0945 | Start data acquistion with Ba-133 source 3“ below top of mu-metal shield, triggering on phonon channels with 0.4 ms trigger delay and 3.2768 ms trace length. OR phonon trigger threshold 25 ADC bins for all phonon channels, and coincidence time set to 10 μs. Flash for one hour, followed by cool down for 2 hours. Then take twelve 5-minute data series each at -/+2 V & +/-3 V biases. Flash all LEDs for 6 seconds between data series with usual settings, and wait 20 minutes for cryostat to cool. Finish with a 20 minute flash and 2-hour cool down. |
|---|---|
| Phonon pulses in test data set look good. Trigger rate is around 15 Hz. |