2012/11/11
| 0145 | Finished zapping SQUIDs. Remove quadrant of top shielding and insert Ba-133 source, 6“ below top of mu-metal shield. |
|---|---|
| Start data acquistion with Ba-133 source, triggering on charge channels with 0.1 ms trigger delay and 0.4096 ms trace length. OR charge trigger threshold 40 ADC bins for all charge channels, and coincidence time set to 10 μs. Flash for one hour, followed by cool down for 2 hours. Then take four 30-minute data series each at +/-2 V & -/+2 V biases. Flash all LEDs for 6 seconds between data series with usual settings, and wait 20 minutes for cryostat to cool. Finish with a 20 minute flash and 2-hour cool down. | |
| Test data series pulses look good. Trigger rate varies between 7 Hz and 12 Hz, which is encouraging. Hopefully this data will be of good quality. | |
| 0200 | Take advantage of detector flash to fill N2 cold trap full. |
| 1445 | Filled LN2 cold trap. |
| Fed Cricket 3 pellets. |
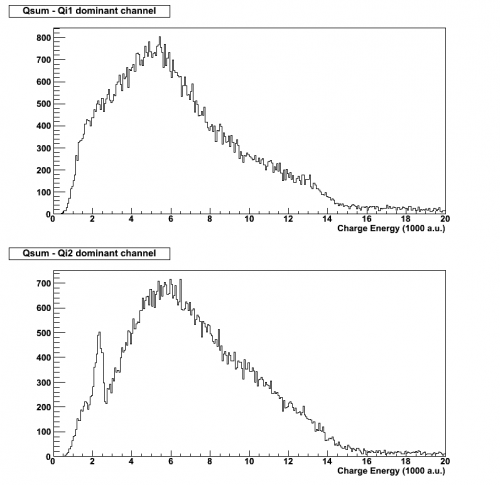
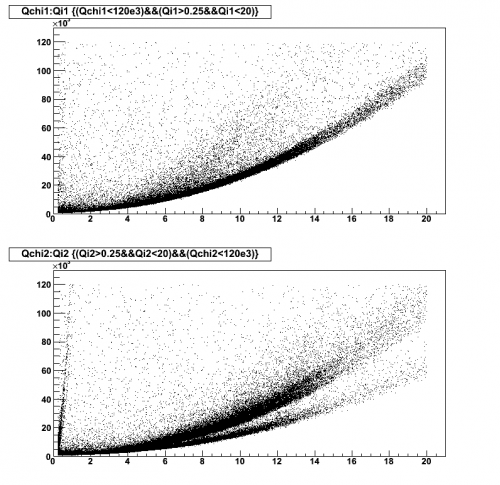
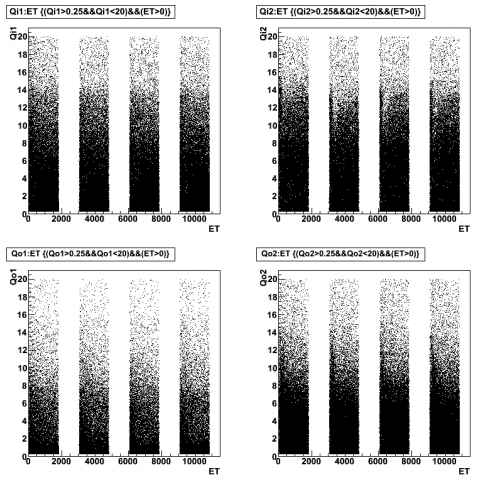
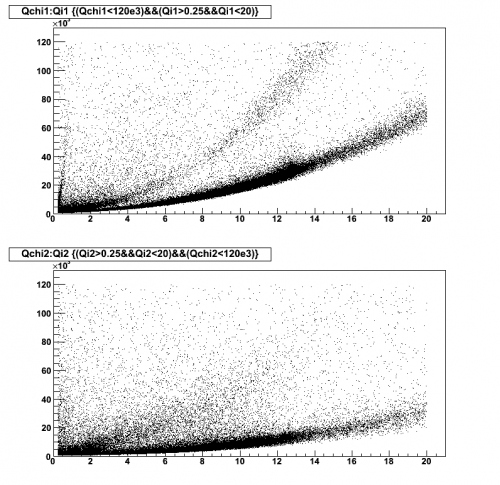
| Figure 1 | |
|---|---|
| Dib1/2: +/- 2 V | |
| 07121111_0447 07121111_0537 07121111_0627 07121111_0717 |
|
 |  |
 | |
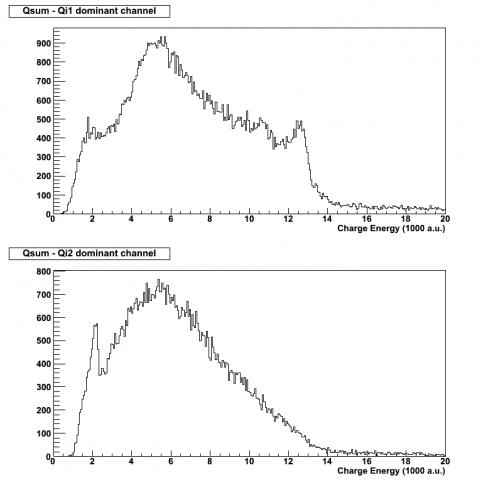
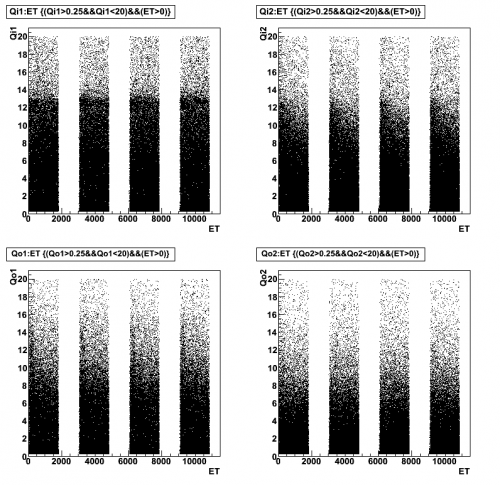
| Figure 2 | |
|---|---|
| Dib1/2: -/+ 2 V | |
| 07121111_0808 07121111_0859 07121111_0949 07121111_1039 |
|
 |  |
 | |
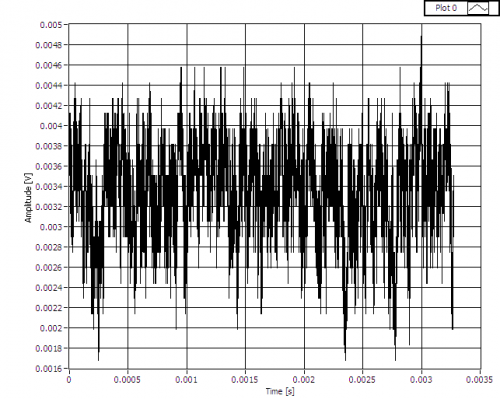
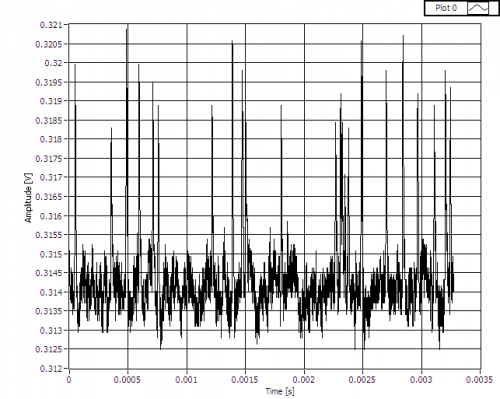
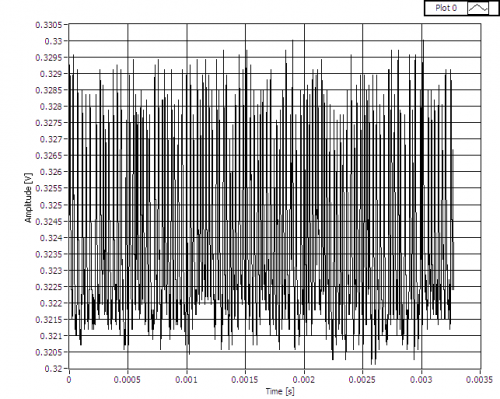
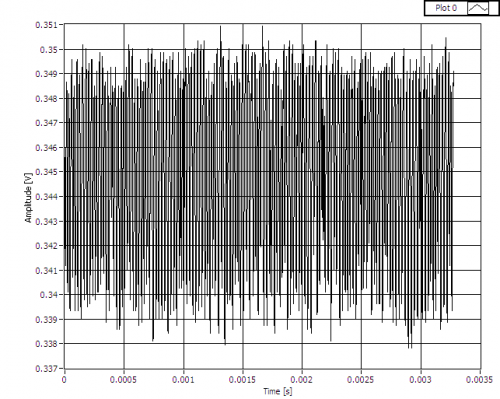
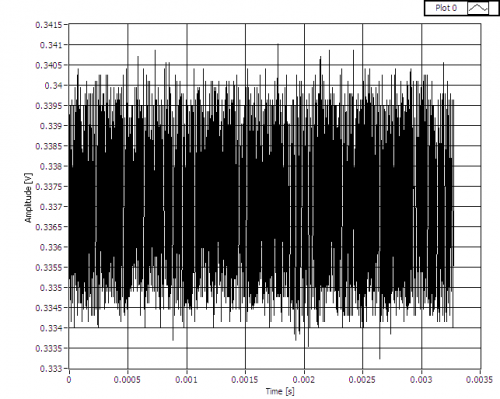
| 2130 | While taking IbIs measurements of A3, a noisy baseline was witnessed at certain QET biases. Fig. 3 shows the baseline at 0 μA, Fig. 4 shows the evolution of the signal as the QET bias is increased between 9 μA and 11 μA. Similar waveforms are seen at other QET biases of 170 μA, -22 μA & -400 μA in Fig. 5, 6 & 7 respectively. Noisy baselines seem to appear at baselines around 300-350 mV. This could be a resonance. |
|---|
| Figure 3: Phonon channel A3 baseline at QET bias of 0 μA. |
|---|
 |
| Figure 4: Phonon channel A3 baseline at QET biases of 9 μA, 9.1 μA, 9.3 μA, 10 μA, 10.2 μA, 10.4 μA & 11 μA. | |
|---|---|
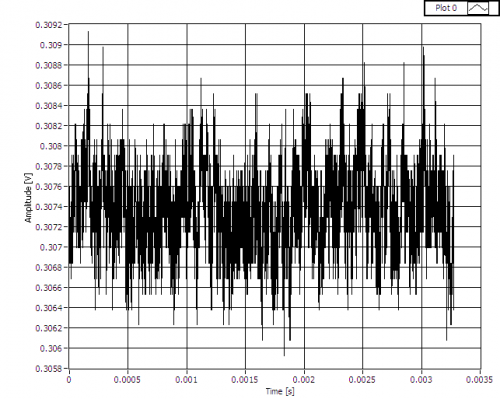 | QET bias of 9 μA; similar to waveform in Fig. 3. |
 | QET bias of 9.1 μA; development of what look like “hairs”. |
 | QET bias of 9.3 μA; sudden increase in noise, similar to baseline at 9.1 μA. The “hairs” above the baseline have increased in number and are still visible. |
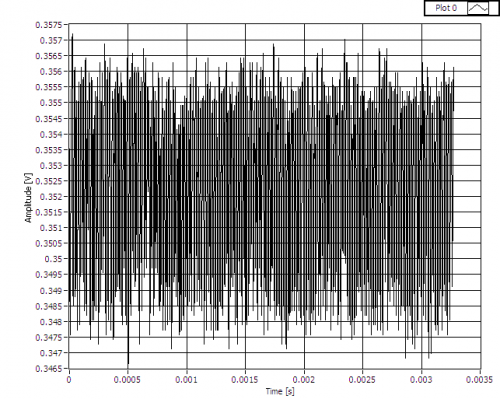 | QET bias of 10 μA; noise at similar level to that seen at 9.3 μA. However, the “hairs” have all but disappeared. |
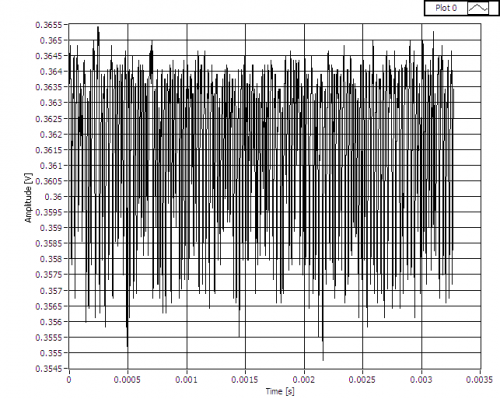 | QET bias of 10.2 μA; similar to what is seen when QET bias is 9.3 μA, but “hairs” emerge from below the baseline. |
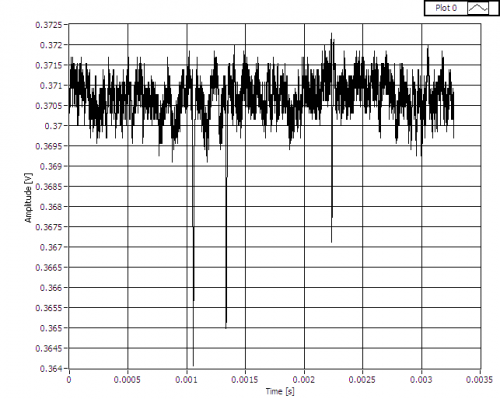 | QET bias of 10.4 μA; similar to what is seen when QET bias is 9.1 μA, but “hairs” emerge from below the baseline. |
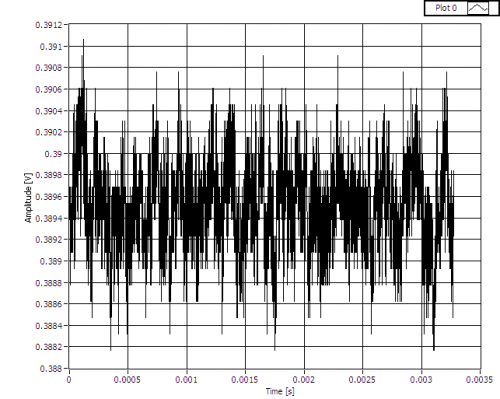 | QET bias of 11 μA; noisy baseline has disappeared. Similar to waveform in Fig. 3 and when QET bias is 9 μA. |
| Figure 5: Phonon channel A3 baseline at QET biases of 160 μA, 170 μA & 180 μA. | |
|---|---|
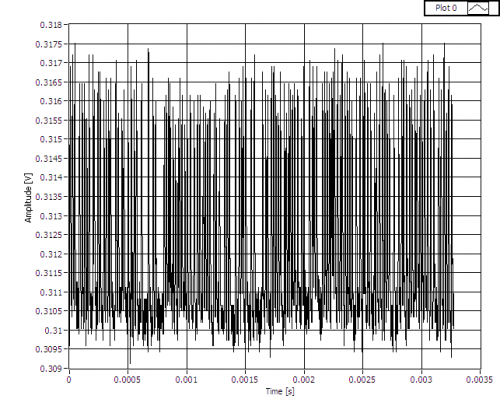 | QET bias of 160 μA. |
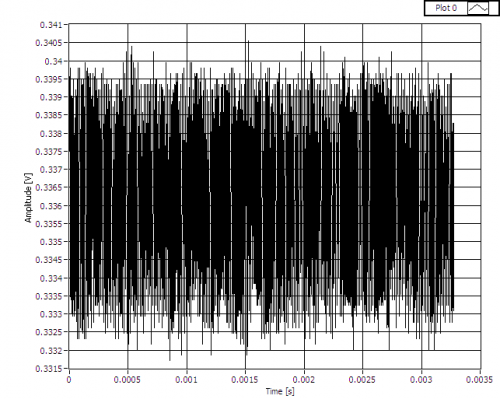 | QET bias of 170 μA. |
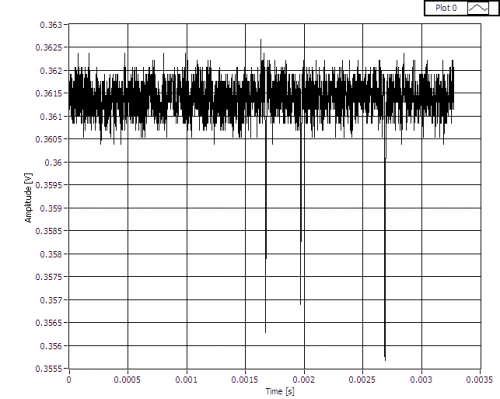 | QET bias of 180 μA. |
| Figure 6: Phonon channel A3 baseline at QET bias of -22 μA. |
|---|
 |
| Figure 7: Phonon channel A3 baseline at QET bias of -400 μA. |
|---|
 |
| 2200 | Although a 356 keV peak is visible in Side 1's charge spectra at -/+2 V (Fig. 2), it appears as though the bulk of the crystal is deneutralised within the first 5 minutes. Perhaps an attempt should be made to take data over this time period at low biases. |
|---|---|
| Start data acquistion, triggering on charge channels with 0.1 ms trigger delay and 0.4096 ms trace length. OR charge trigger threshold 40 ADC bins for all charge channels, and coincidence time set to 10 μs. Flash for one hour, followed by cool down for 2 hours. Then take ten 5-minute data series each at +/-2 V, -/+2 V, +/-1 V & -/+1 V biases. Flash all LEDs for 6 seconds between data series with usual settings, and wait 20 minutes for cryostat to cool. Finish with a 20 minute flash and 2-hour cool down. | |
| Phonon pulses in test data set look fine. Trigger rate is around 8 Hz. | |
| 2355 | Take advantage of detector flash and cool down to fill N2 cold trap full. |