2012/11/01
| 0500 | Wasn't happy with phonon pulses, so ended up zapping the SQUIDs quite a few times. Still not happy with the trigger rate, but let's try to take data at +/-2 V (which was good in the past) and +/-2.5 V (which we identified as bad). This may give us a clue as to whether the problem lies with the xml files or the setup of the boards. |
|---|---|
| Start data acquistion, triggering on charge channels with 0.1 ms trigger delay and 0.4096 ms trace length. OR charge trigger threshold 40 ADC bins for all charge channels, and coincidence time set to 10 μs. Flash for one hour, followed by cool down for 2 hours. Then take two 30-minute data series each at +/-2 V & +/-2.5 V biases. Flash all LEDs for 6 seconds between data series with usual settings, and wait 20 minutes for cryostat to cool. Finish with a 20 minute flash and 2-hour cool down. | |
| Pulses from test data set are reasonable. Trigger rate varies between 4-5 Hz, which is lower than one would wish, but higher than 1 Hz that it has been over the last few nights. Perhaps the data will be of good quality. We'll know in the morning - shouldn't take too long to reduce once we've acquired it. | |
| 0505 | Take advantage of flashing to fill N2 cold trap full. |
| 1005 | Fed Cricket 3 pellets. |
| 1020 | Filled LN2 cold trap. |
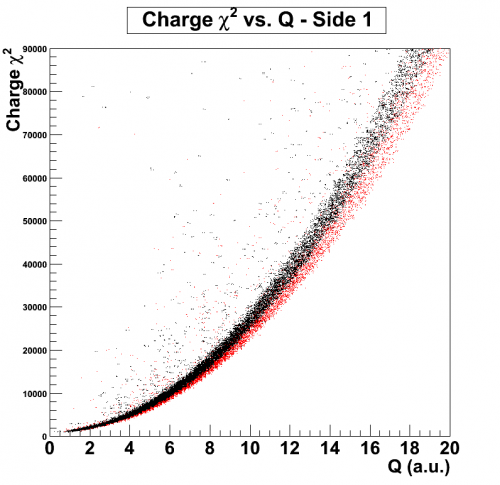
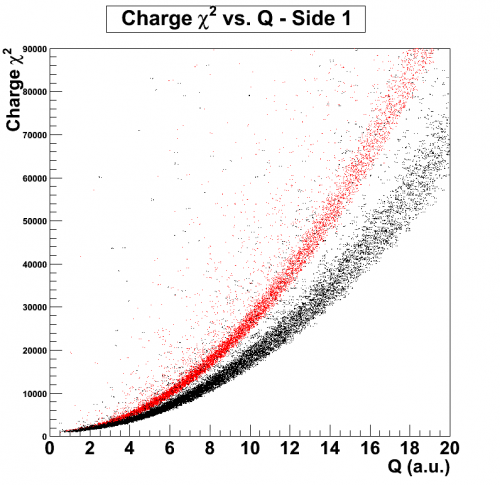
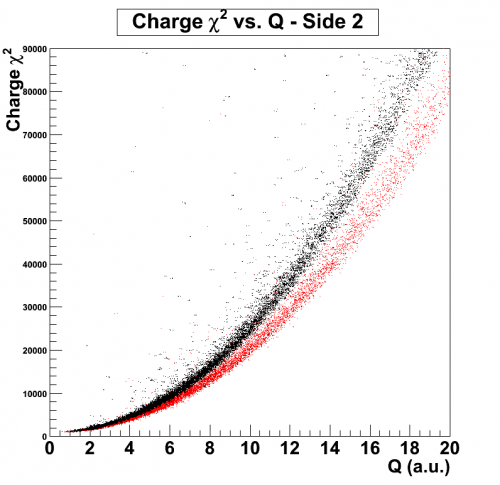
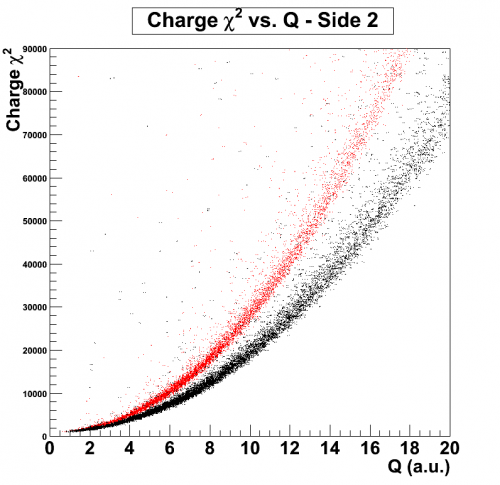
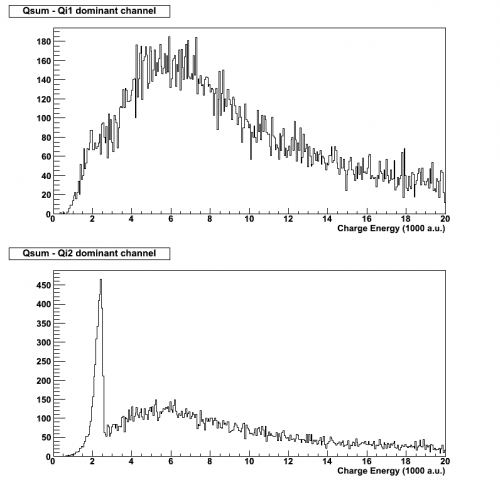
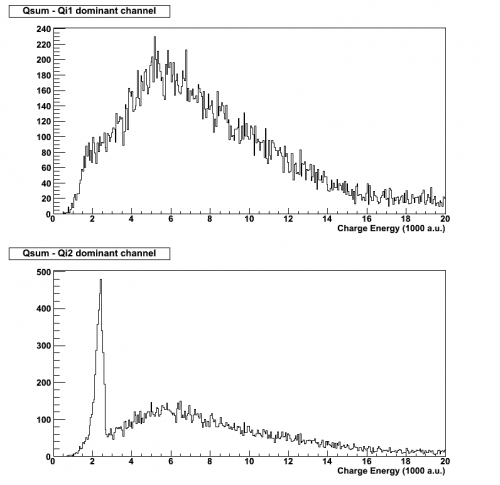
| A look at the Chi2 distribution from this morning's data. Note that for +/- 2.5 V, the bands, though individually fine, don't overlap. One possibility for this is that the lights were turned on above the DCRC boards during the second series. |
|
|---|---|
| Dib1/2: +/- 2 V | Dib1/2: +/- 2.5 V |
| Red: 07121101_0758 Black: 07121101_0849 | Red: 07121101_0940 Black: 07121101_1030 |
 |  |
 |  |
 |  |
| 1800 | Fed Cricket 4 pellets. |
|---|---|
| 2355 | From Roxanne's analysis above, it looks like we've solved the problem we were having with the trigger. |
| Start data acquistion, triggering on charge channels with 0.1 ms trigger delay and 0.4096 ms trace length. OR charge trigger threshold 40 ADC bins for all charge channels, and coincidence time set to 10 μs. Flash for one hour, followed by cool down for 2 hours. Then take four 30-minute data series each at -/+2.5 V & +/-2.5 V biases. Flash all LEDs for 6 seconds between data series with usual settings, and wait 20 minutes for cryostat to cool. Finish with a 20 minute flash and 2-hour cool down. | |
| Pulses from test data set are reasonable. Trigger rate varies between 2-3 Hz, which is lower than that at start of previous data acquisition, but higher than 1 Hz when we had a problem. Perhaps the data will be of good quality. Again, we'll know in the morning. |