2012/08/02
| 0002 | Filled LN2 cold trap. |
|---|---|
| 0005 | 1-shot method - closed V13A, opened V9 |
| 0950 | Fed Cricket 3 pellets. |
| 1030 | Filled LN2 cold trap. |
| 1700 | V6 closed; Open V13A |
| 1812 | Fed Cricket 4 pellets. |
| 2232 | Begin LHe transfer (19.5%). |
| O-ring on transfer stick broken. Need to replace it. | |
| 2300 | End LHe transfer (55.5%). |
| 2324 | Put 75 mbar of mixture into dump based on tests done… hopefully will give us base temperature of ~ 65 mK tomorrow. |
Temerature and Pressure Plots
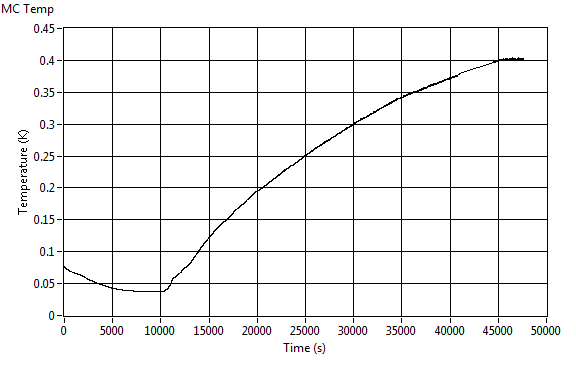
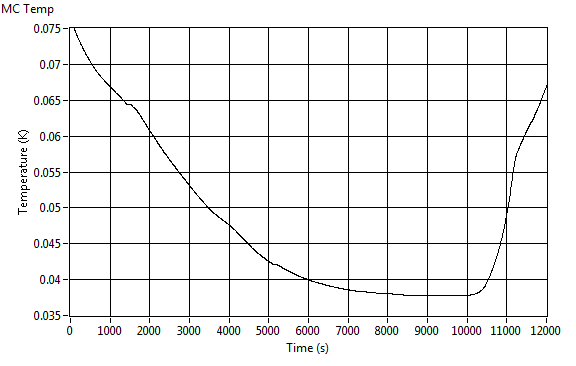
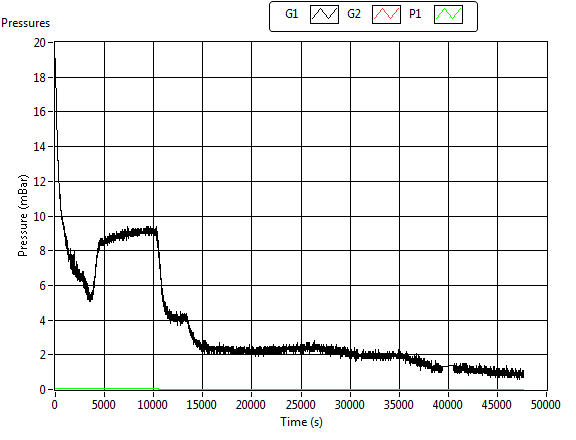
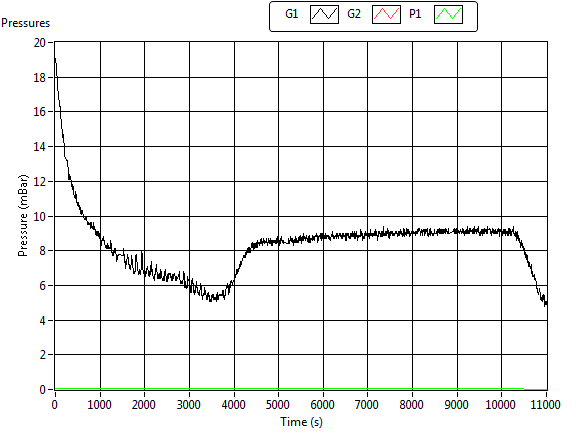
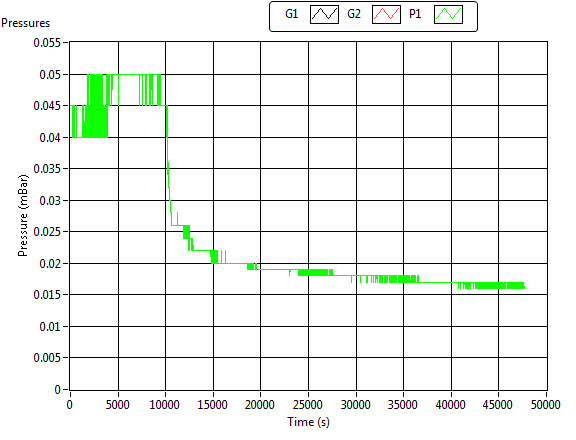
Figures 1-4 shows plots of MC Temperature and G1/G2/P1 Pressures taken starting at 00:05 this morning. The left plot shows the full data set, while the right plot shows a zoomed in view of important plot features.
| Figure 1: MC Temperature Plots | |
|---|---|
 |  |
| Figure 2: G1 Pressure Plots | |
|---|---|
 |  |
| Figure 3: G2 Pressure Plots | |
|---|---|
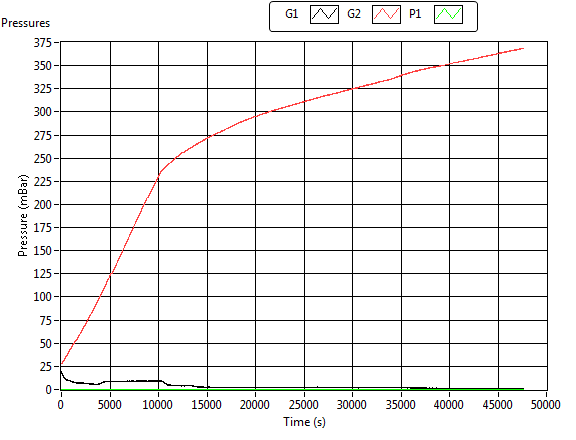 | 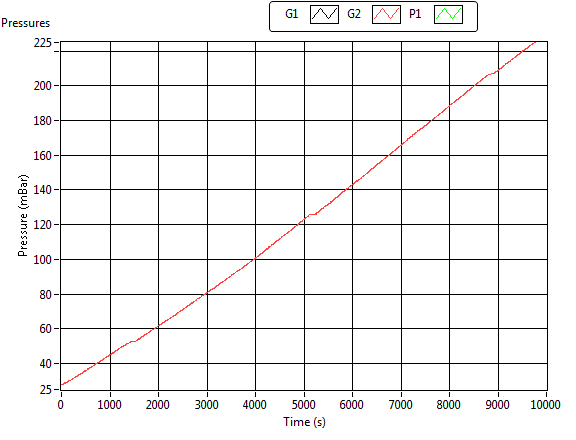 |
| Figure 4: P1 Pressure Plots |
|---|
 |
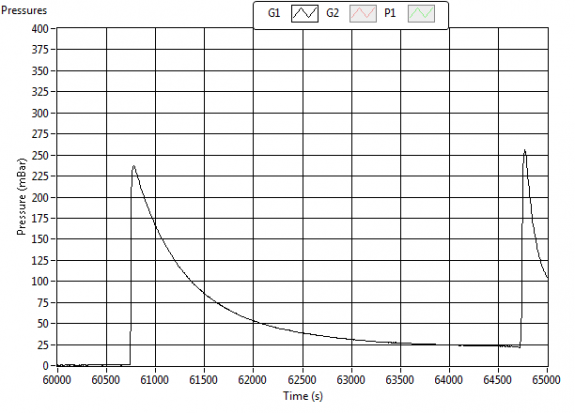
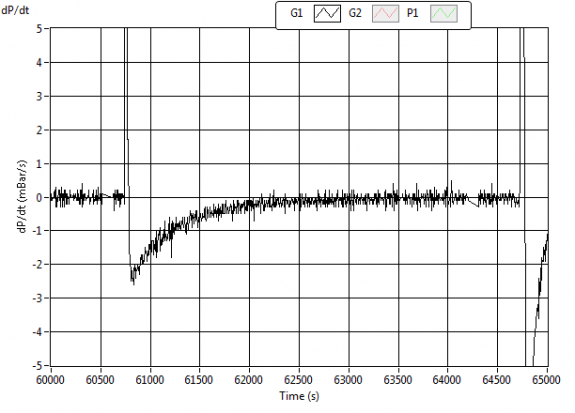
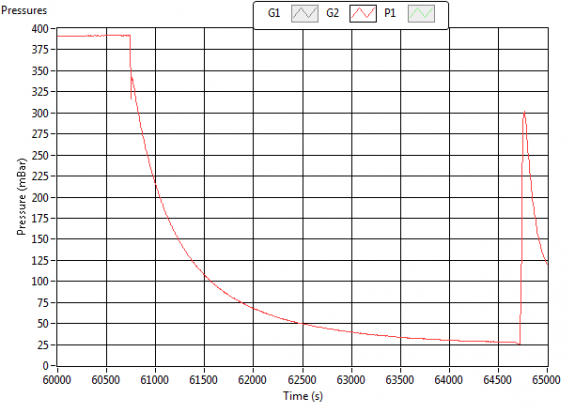
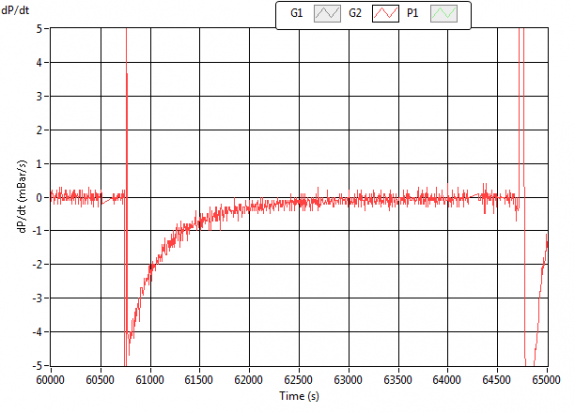
Figures 5 & 6 show plots of G1/G2 Pressures and their respective time derivatives taken between approximately 16:45 and 18:10 today. The left plot shows the pressure data set, while the right plot shows the time derivative of the pressure data set.
| Figure 5: G1 Pressure Plot and G1 Time Derivative Plot | |
|---|---|
 |  |
| Figure 6: G2 Pressure Plot and G2 Time Derivative Plot | |
|---|---|
 |  |