Table of Contents
2012/07/25
| 0948 | Filled LN2 cold trap. |
|---|---|
| 1020 | Fed Cricket 3 pellets. |
| 1348 | Last data series finished. Data was taken at 62mK. |
| 1605 | Zapped SQUIDs on DCRC31 twice. |
| 1655 | Zapped SQUIDS on DCRC31 twice. |
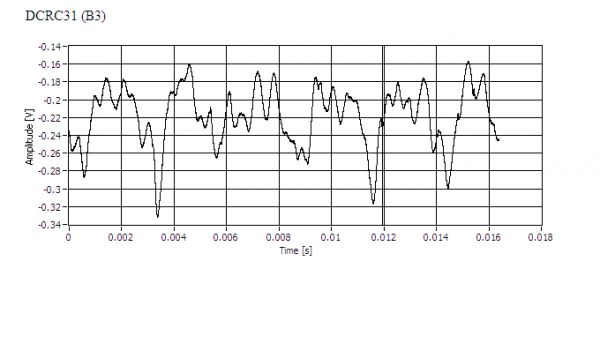
| 1704 | The phonon signal isn't great when you increase the QET bias to a certain value(Figure 1). Table 1 also shows values for transition from normal baseline to the signal you see below for each channel. |
| Channel B3 with DCRC31 |
|---|
 |
| Table 1: DCRC31 settings | ||||||
|---|---|---|---|---|---|---|
| Driver offset (V) | SQUID Bias(uA) | Lockpoint (mV) | Modulation Depth | QET Bias (uA) | Transition | Polarity |
| 0 | 82.02 | 4.2 | 3.0 | -37 | NI | |
| 0 | 71.28 | 3.31 | 4.1 | -33 | NI | |
| 0 | 83 | 5.16 | 4.7 | -70 | NI | |
| 0 | 86.05 | 3.5 | 5.0 | -68 | I | |
| 1833 | Filled LN2 cold trap. |
|---|---|
| 2313 | ZAP DIB2/DCRC32 SQUIDs |
| 2318 | ZAP DIB1/DCRC33 SQUIDs |
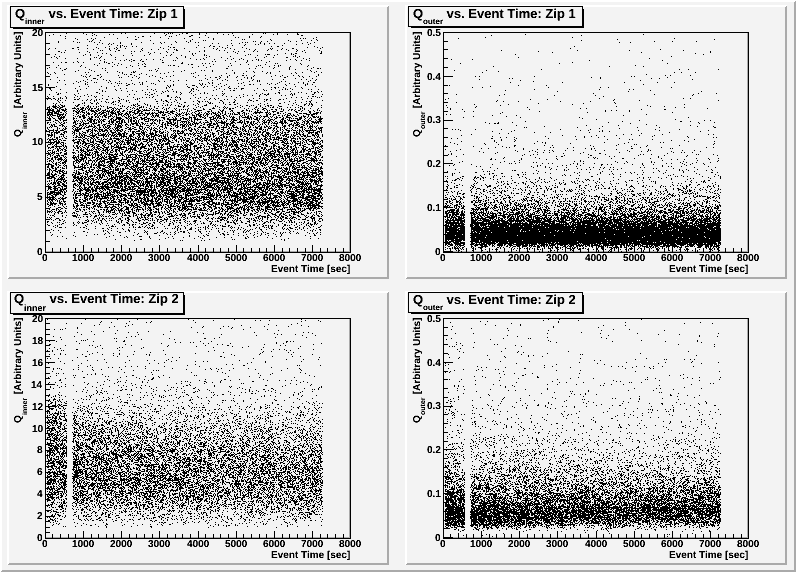
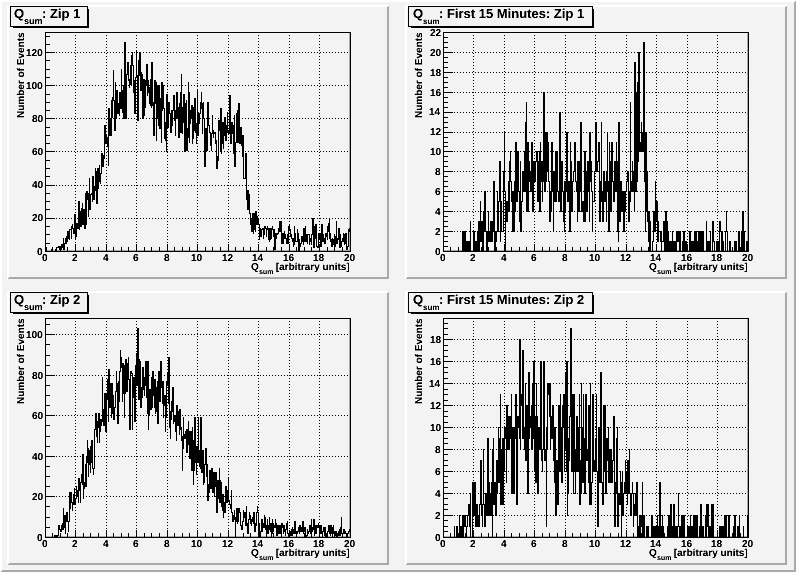
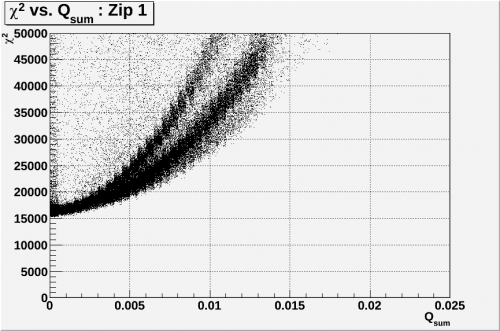
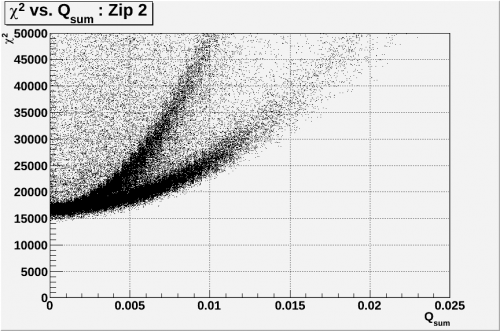
Data Set 07120725_0156 with Ba-133 & Am-241 and DIB1 -2 V, DIB2 +2 V
| Figure 1: Qi and Qo vs Event Time for zip 1 and zip 2 (no cross talk). Bulk, Qi and χ squared cuts. |
|---|
 |
| Figure 2: Qsum spectra. Qi and χ squared cuts. |
|---|
 |
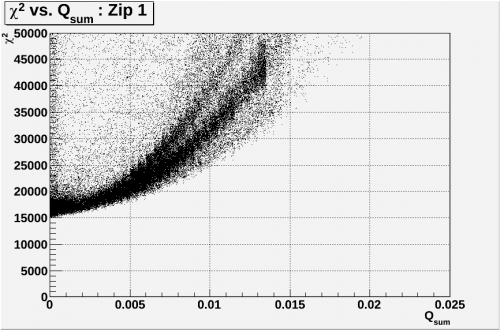
| Figure 3: χ Squared vs. Qsum. Qi cut. | |
|---|---|
 |  |
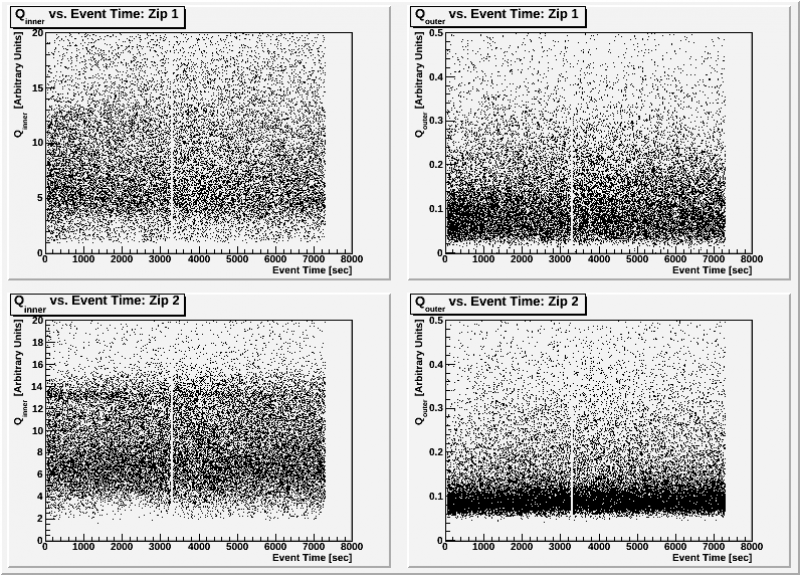
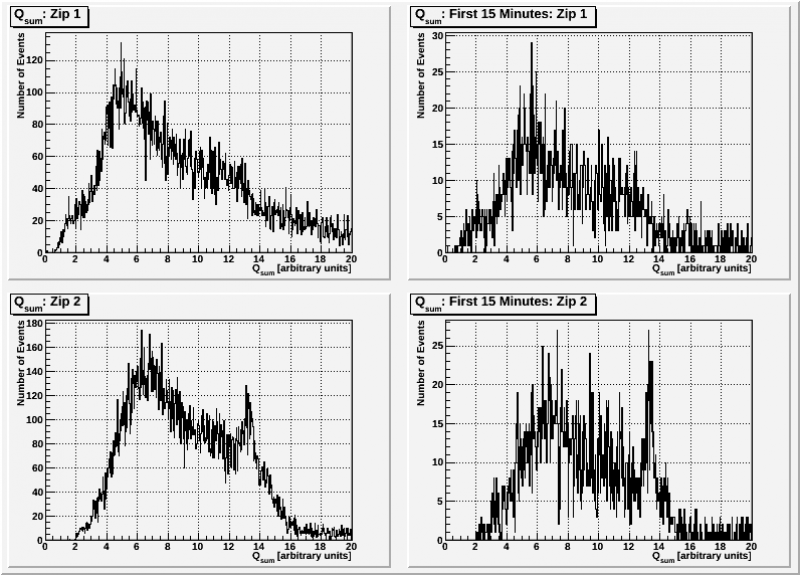
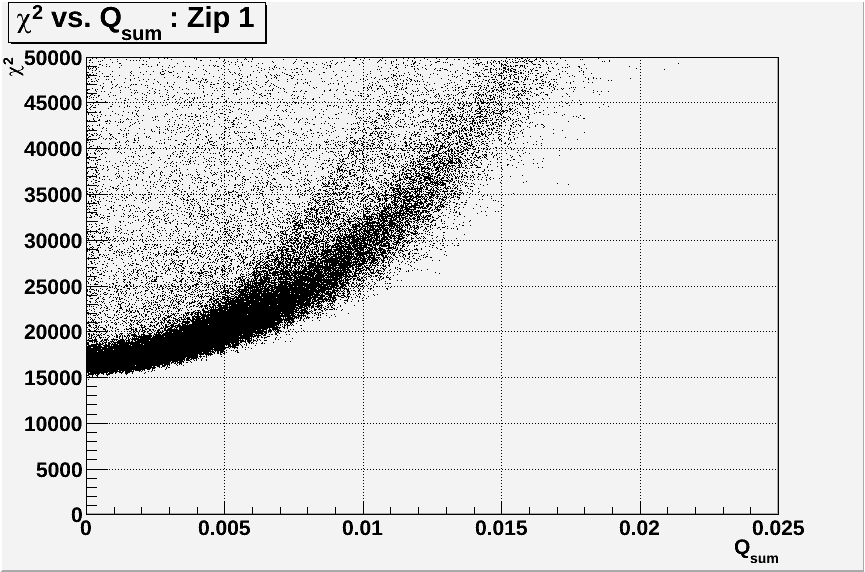
Data Set 07120725_0911 with Ba-133 & Am-241 and DIB1 +6 V, DIB2 -6 V
| Figure 1: Qi and Qo vs Event Time for zip 1 and zip 2 (no cross talk). Bulk, Qi and χ squared cuts. |
|---|
 |
| Figure 2: Qsum spectra. Qi and χ squared cuts. |
|---|
 |
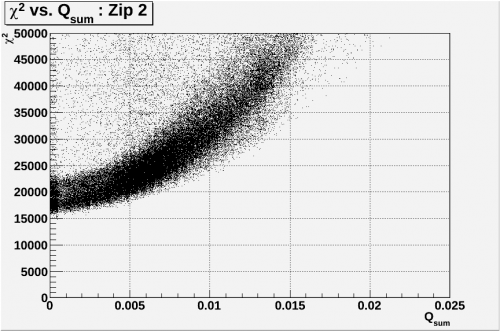
| Figure 3: χ Squared vs. Qsum. Qi cut. | |
|---|---|
 |  |
Data Set 07120725_1134 with Ba-133 & Am-241 and DIB1 -6 V, DIB2 +6 V
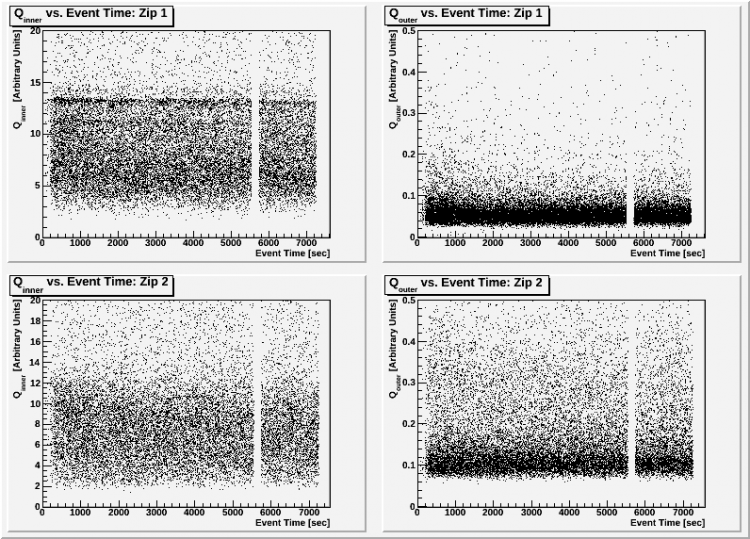
| Figure 1: Qi and Qo vs Event Time for zip 1 and zip 2 (no cross talk). Bulk, Qi and χ squared cuts. |
|---|
 |
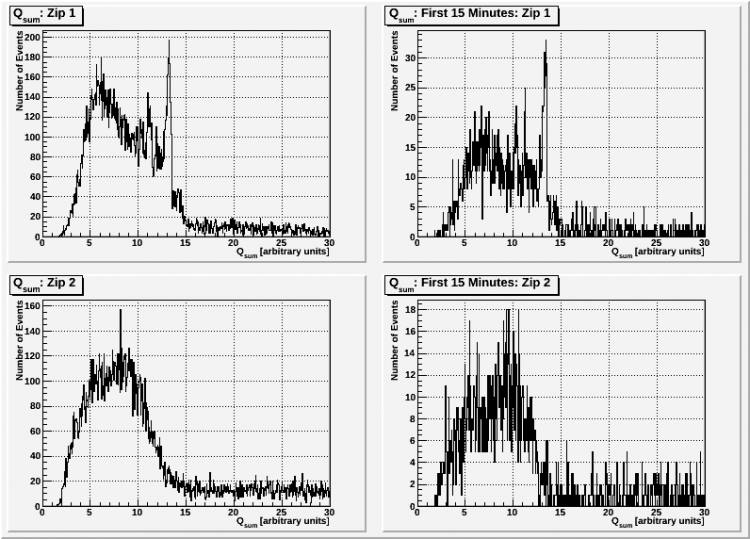
| Figure 2: Qsum spectra. Qi and χ squared cuts. |
|---|
 |
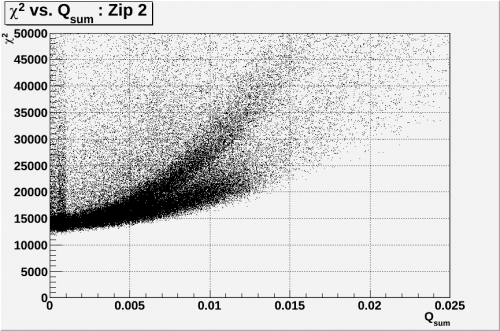
| Figure 3: χ Squared vs. Qsum. Qi cut. | |
|---|---|
 |  |