2012/05/13
| 0100 | Start taking data: three 2-hour long series with D1 +2 V and D2 -2 V; followed by three 2-hour long series with D1 -2 V and D2 +2 V. Flash detector for 6 s in between series (0.6 mA current, 100 μs off, 5 ms on, all LEDs except DIB1 LED2). |
|---|---|
| 1400 | DAQ crashed last night at 0348, but managed to collect one complete data set beforehand: 07120513_0059 (D1 +2 V, D2 -2 V). |
| Start flashing detector. | |
| 1415 | Fill N2 cold trap full. |
| 1535 | Commence helium transfer. Helium liquid level 3.4%. |
| 1620 | Cease helium transfer. Helium liquid level 87.4%. |
| 1715 | Stop flashing detector. |
| 1915 | Take 0 V data to investigate DIB2 Qo's erratic baseline: 07120513_1911 (1.6384 ms trace length). |
| Figure 1: Typical pulses from data series 07120513_1911 (1.6384 ms trace length). | ||
|---|---|---|
| DIB1 Qi | 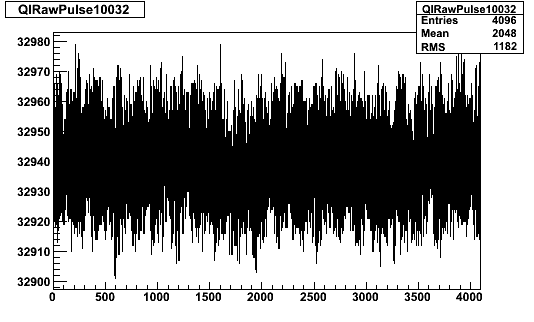 | 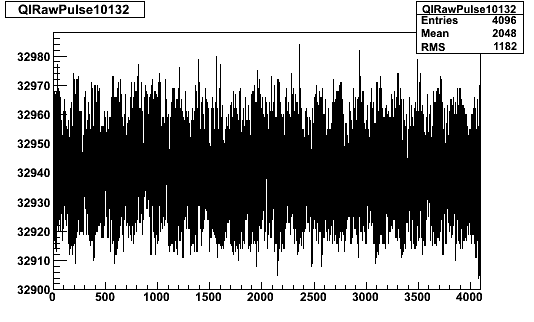 |
| DIB1 Qo | 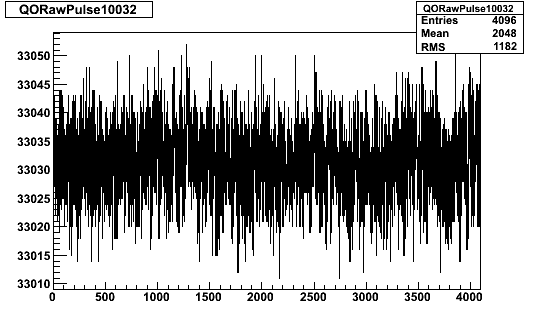 | 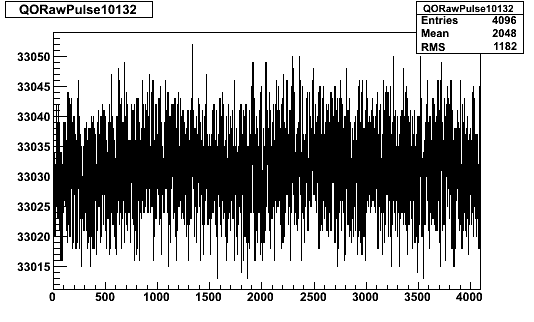 |
| DIB2 Qi | 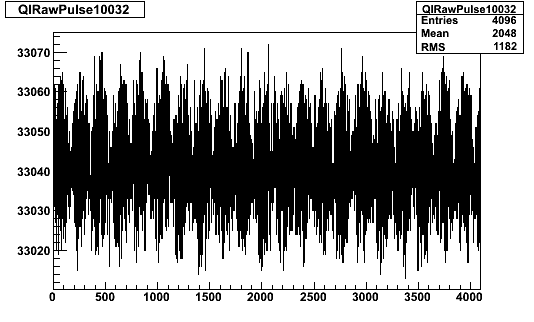 | 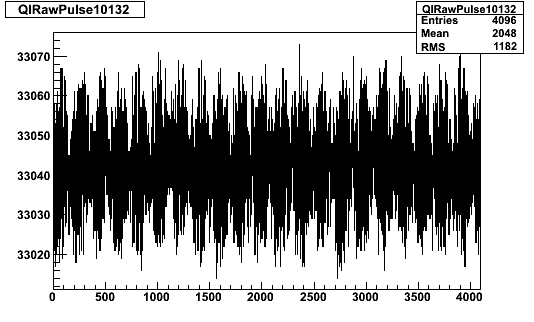 |
| DIB2 Qo | 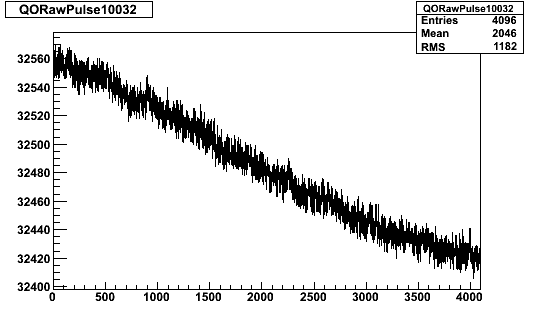 | 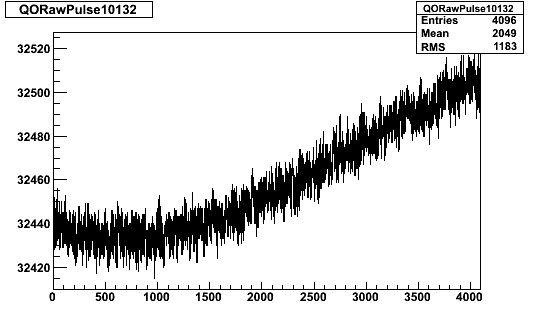 |
| 1930 | Take 0 V data with longer trace length: 07120513_1927 (26.2144 ms trace length). |
|---|
| Figure 2: Typical pulses from data series 07120513_1927 (26.2144 ms trace length). | |
|---|---|
| DIB1 Qi | 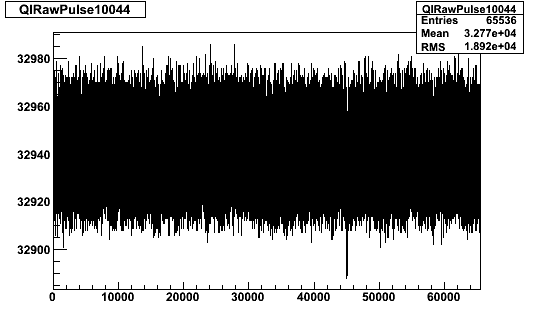 |
| DIB1 Qo | 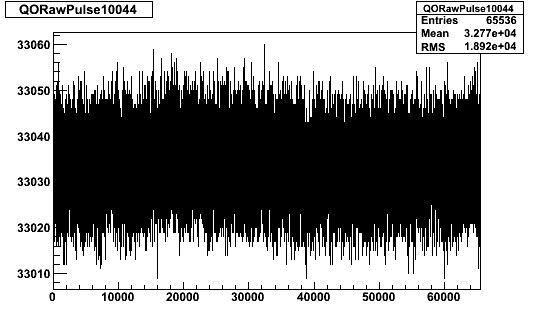 |
| DIB2 Qi | 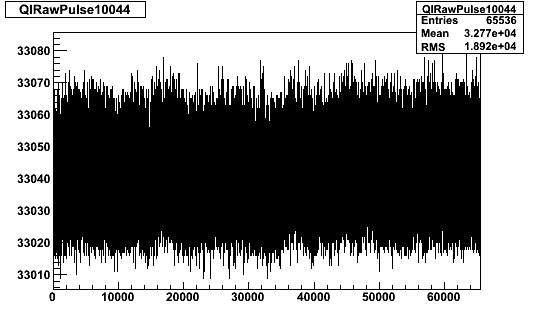 |
| DIB2 Qo | 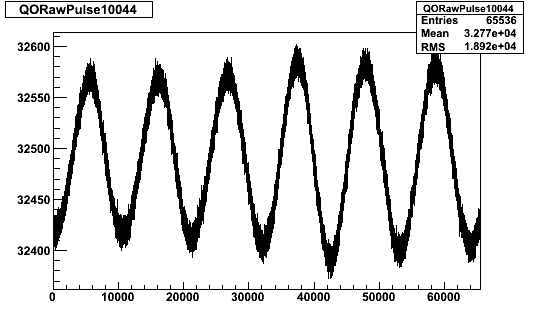 |
| 2140 | Perform charge breakdown measurments: |
|---|
| Table 1: Summary of Charge Breakdown Measurements. | ||
|---|---|---|
| DIB 1 | DIB 2 | |
| DIB 1 negative | No indication | Hint at -/+7.0 V (Qi) |
| DIB 1 positive | No indication | Hint at +/-11.0 V (Qi) |
| 2145 | Start flashing detector. |
|---|---|
| 2330 | Stop flashing detector. |
| 2345 | Fill N2 cold trap full. |
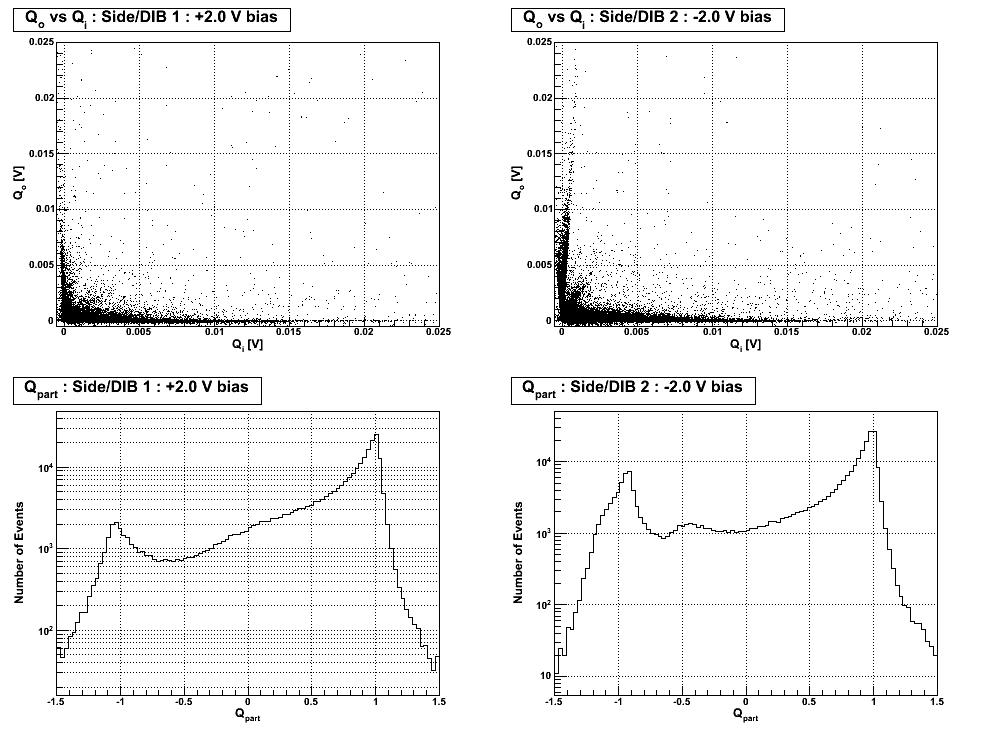
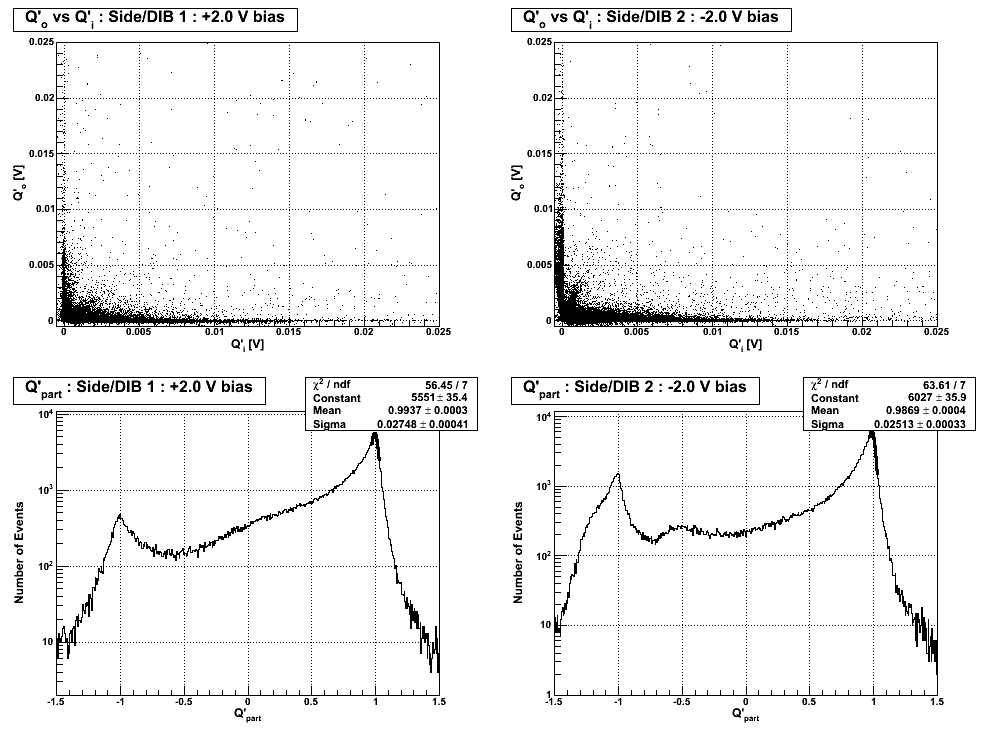
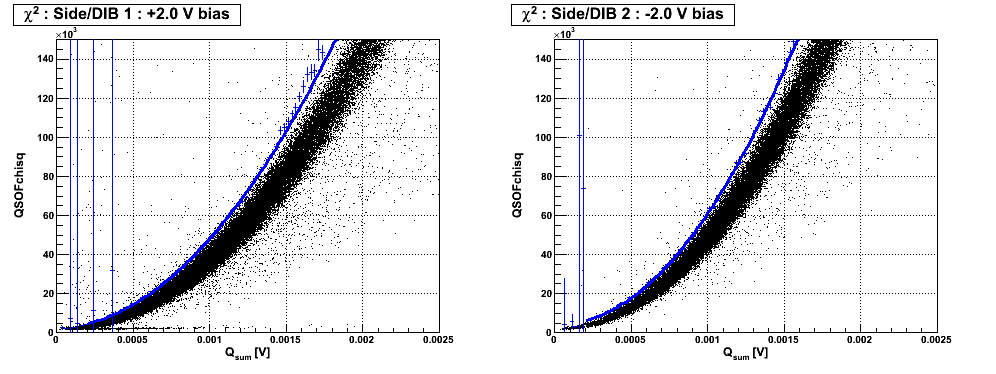
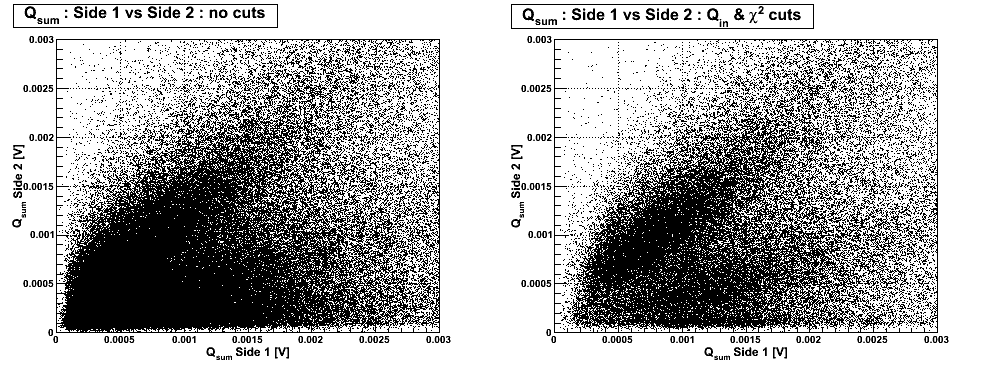
Quick Analysis of First Data Series 07120513_0059 (DIB1 +2.0 V, DIB2 -2.0 V)
| Figure 3: Apparent Cross-Talk between Qi & Qo |
|---|
 |
| Figure 4: Qi vs Qo and Qpart for Sides 1 & 2 after Cross-Talk Correction. |
|---|
 |
| Figure 5: Chi-squared Distributions. |
|---|
 |
| Figure 6: Qsum for Side 1 vs Side 2. |
|---|
 |
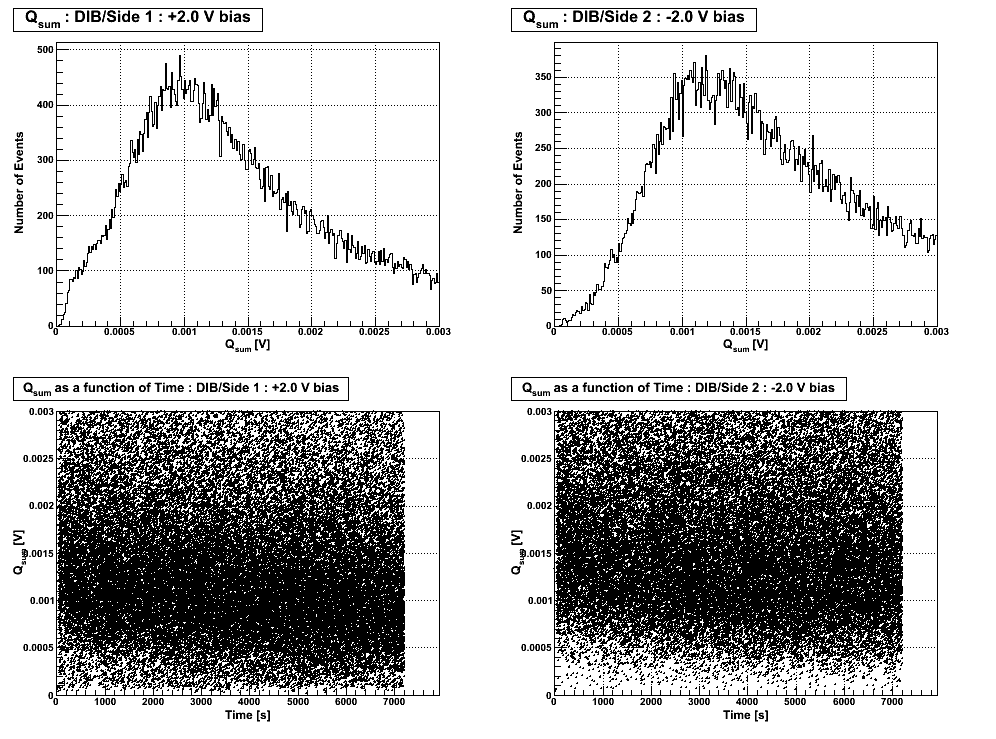
| Figure 7: Qsum Distributions and Time Evolution. |
|---|
 |
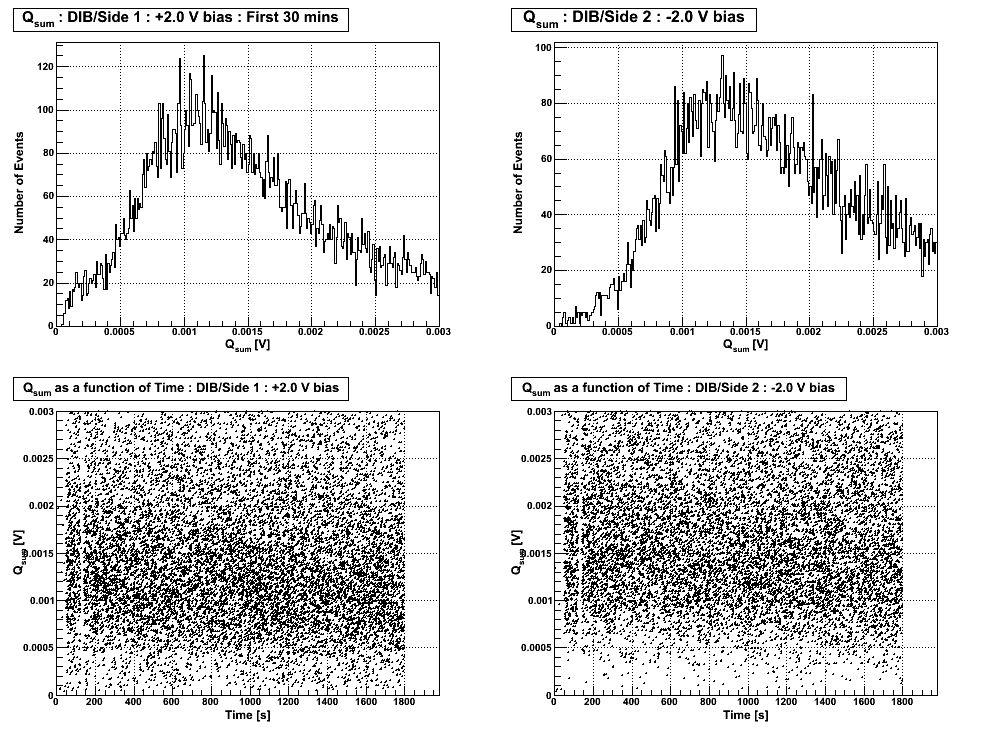
| Figure 8: Qsum Distributions and Time Evolution for first 30 minutes. |
|---|
 |