−Table of Contents
Radon and Particle Counts
by Matt Fritts
Radon
We borrowed a RAD7 radon monitor from SLAC and took radon counts in the lab, cleanroom, and large purge cabinet on the following dates:
| 2015 June 12-13 | main lab area |
|---|---|
| 2015 June 17-18 | main cleanroom area |
| 2015 June 23-25 | large purge cabinet |
| 2015 June 26-28 | upper small purge cabinet |
| 2015 June 29 - July 1 | upper small purge cabinet, improved flow |
| 2015 July 6-8 | large purge cabinet with fixed door |
For each of these two-day tests individual rates were measured each hour. The table below summarizes the results:
| Measurement location | Mean hourly radon count (Bq/m3) | Standard deviation (Bq/m3) | Maximum hourly radon count (Bq/m3) |
|---|---|---|---|
| main lab area | 5.0 ± 0.6 | 4.0 | 16.2 |
| main cleanroom area | 5.4 ± 1.7 | 3.9 | 15.9 |
| large purge cabinet, before fix | 5.7 ± 0.6 | 3.4 | 13.0 |
| small purge cabinet, before fix | 3.7 ± 0.6 | 2.7 | 10.0 |
| small purge cabinet with improved flow | 0.6 ± 0.5 | 1.2 | 5.1 |
| large purge cabinet with fixed door | 0.6 ± 0.4 | 0.8 | 3.0 |
| large purge cabinet with fixed door, 1 week | 0.6 ± 0.2 | 0.7 | 4.1 |
Measurements were taken using a drying tube filled with fresh desiccant and the values above use the RAD7's humidity correction. The measured relative humidity was 10% or less for every measurement.
According to the Wikipedia article on radon, the radon level in the lab is remarkably low for an indoor area, but it's in the same ballpark as measurements made for Little Blue in Tate (around 10 Bq/m^3) and earlier measurements that were stored on this RAD7 unit, perhaps done at Berkeley (around 7 Bq/m^3). The measurement in the cleanroom should probably be about the same, since the cleanroom is in the lab and lab air is blown into the cleanroom - only if particulates contribute to the measurement would there be any difference. And indeed the lab and cleanroom measurements are consistent.
What was surprising was that originally the radon level in the large purge cabinet was no smaller than the measurements done in air. This should be a pure N2 environment. The measurement was done by placing the drying tube in the large purge cabinet and running the tube out through the top cabinet door seal to the RAD7 unit. This produces a gap in the seal. But we also noticed at the time we began the measurement that there was a pretty significant gap even without a tube. It seems that this gap was severely degrading the purge.
For the small purge cabinet, which had no apparent gap in its seal, the original measurement was done by placing the drying tube in the cabinet, removing the brass piece that screws into the cabinet's gas outlet hole, and running the hose through this hole to the RAD7 unit - the thicker portion of the hose is about the right diameter to form a seal in the outlet hole. The second measurements in the small and large purge cabinet were done after fixing the large cabinet door (details below).
After the fix the measured radon in the purge cabinets is very low. The nitrogen supply used for the cabinets is a building-wide nitrogen gas system. I am not sure of the details but it appears to be adequately low in radon content.
Observed issues with the purge cabinets
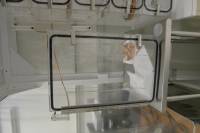
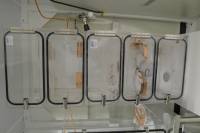
The figure below shows the large purge cabinet (left) and the two small, compartmentalized purge cabinets (right).
| Figure 1a: Purge cabinets | |
|---|---|
 |  |
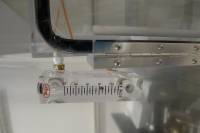
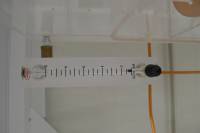
The figure below shows the state of the flow meters for the large cabinet (left) and one of the small cabinets (right) at the time radon measurements began. These are attached to the gas inlets of the three cabinets. The rate is about 4 ft^3/hr for the large cabinet and about 1 ft^3/hr for each of the small ones. The flowmeters for the small cabinets include a black regulator valve at the bottom that controls the flow, but the flowmeter for the large cabinet has no control valve. Nick M recalls that when the cabinets were installed the crew adjusted the rates of the two small cabinets so that the three rates were approximately equal. They are not equal now, and the flow rates of the small cabinets seem to be at maximum because opening the valves further does not increase the flow rate - but see below…
| Figure 1b: Flowmeters on purge cabinet gas inlets | |
|---|---|
 |  |
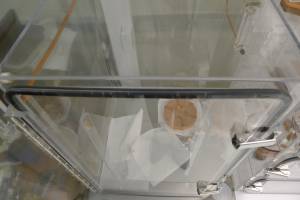
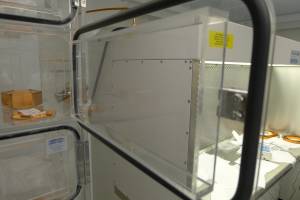
The door to the large purge cabinet is bowed, so that the top and bottom gaskets do not touch the acrylic near the middle when the door is closed. I was able to feel a slight breeze coming out from the top gap. Tightening the clamps that close the door actually make the bowing worse. Perhaps for some period of time these clamps were too tight and caused the door to bow.
The figure on the left sort-of shows the gap. On the right I show an open door from one of the small cabinet compartments, which don't seem to have this problem. On the door of the smaller compartment you can see that there are both vertical and horizontal bracings which presumably are meant to prevent bowing. But the door of the large cabinet has only vertical bracings.
| Figure 1c: Doors of purge cabinets | |
|---|---|
 |  |
If I press on the door of the large cabinet at the top and the bottom, I can close the gap - and cause the flow rate to the large cabinet to fall to zero and the rates of the other two cabinets to increase. This probably suggests that originally the gap was smaller, since previously the rates were about the same in all three cabinets.
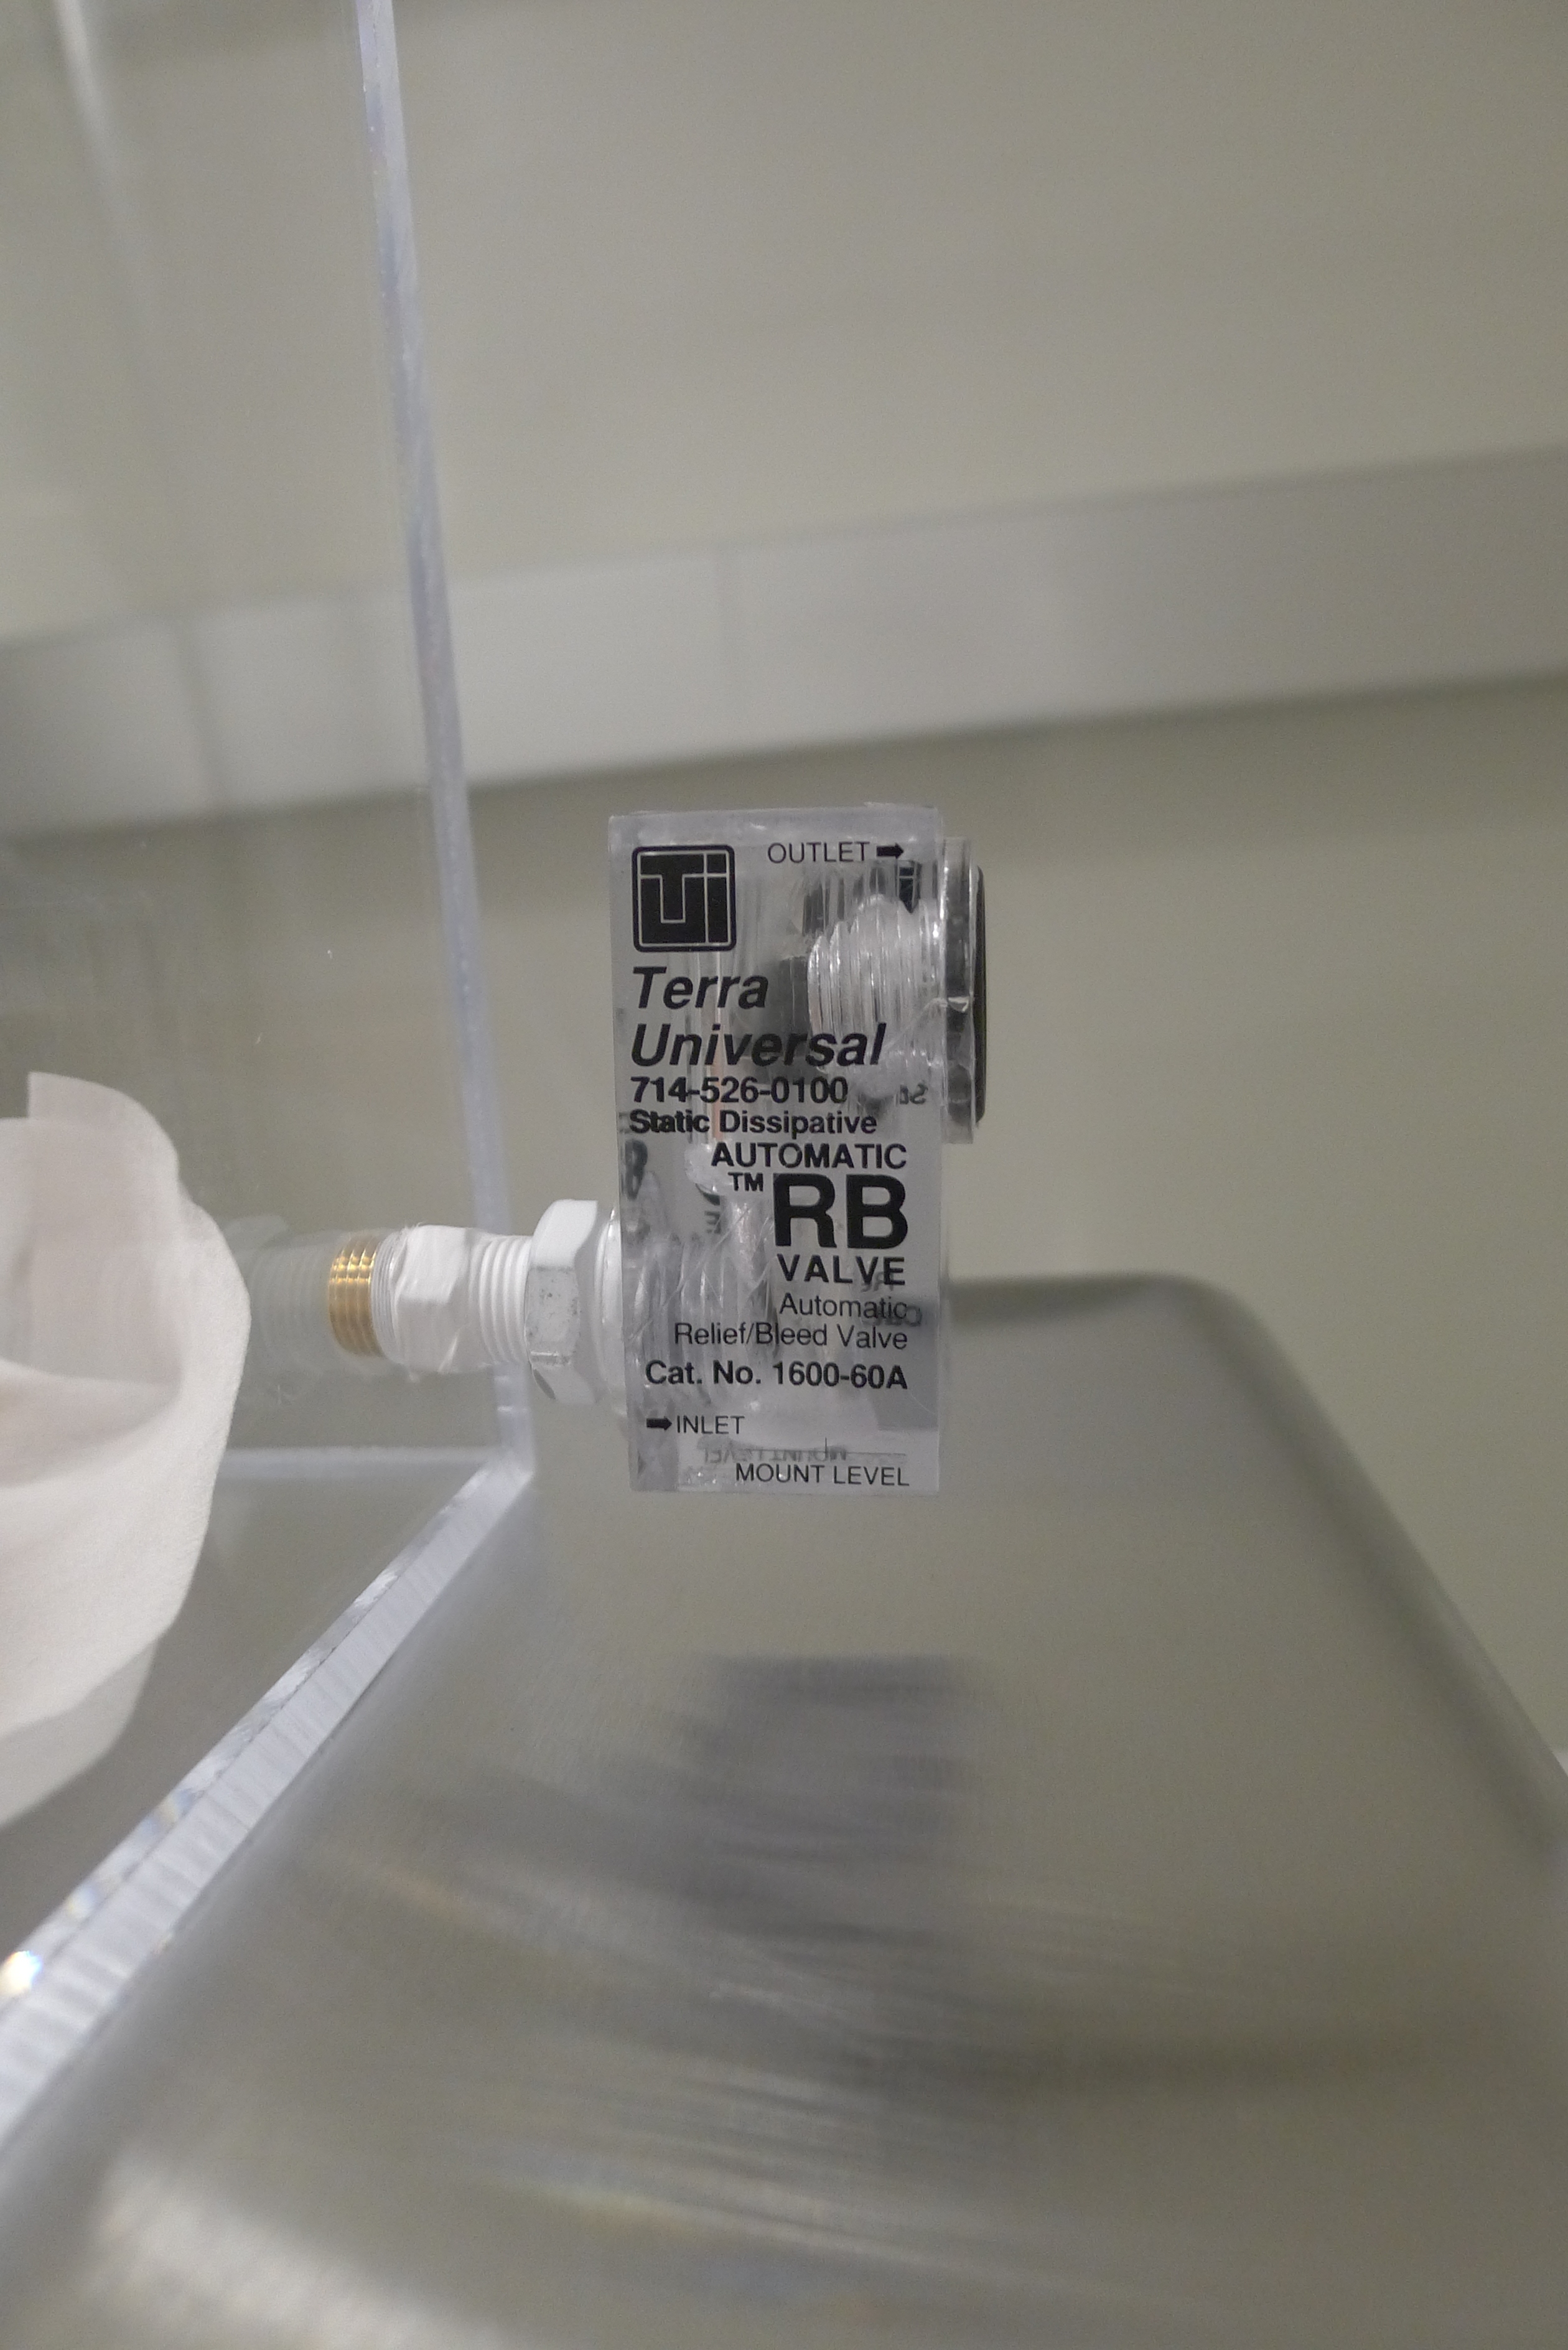
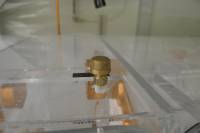
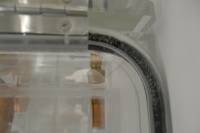
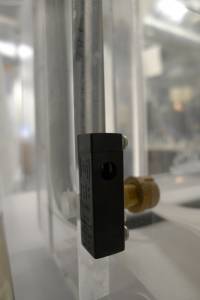
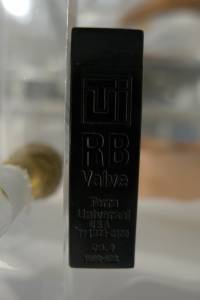
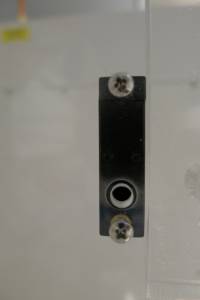
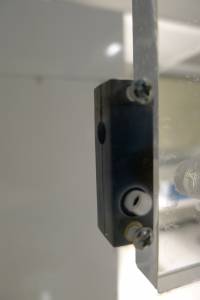
This raises the question of how the purge cabinets are designed to let gas out, so that there is a continuous flow. For the large cabinet there is apparently some sort of release valve, shown in the figure below (left). For the other two cabinets there are brass tubes with a simple screw-on caps as well as release valves built into the wall. Pressing on the door to complete the seal causes the flow rate into the inlet to drop to zero. Maybe if the pressure builds up high enough it starts to open and let out some gas. That seems to be how it's meant to work: see this description from the manufacturer.
| Figure 1d: Outlets of purge cabinets | |||
|---|---|---|---|
 |  |  | |
 |  |  |  |
Fixing the door on the large purge cabinet
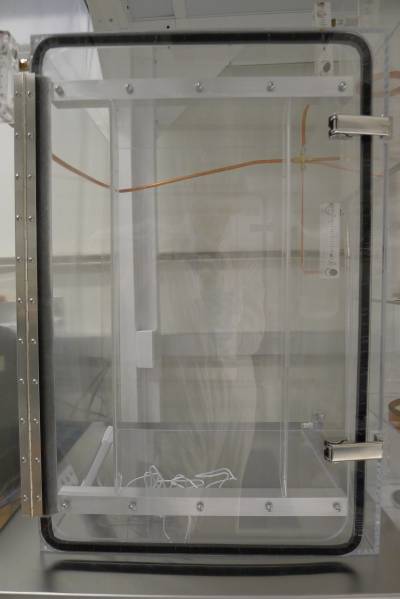
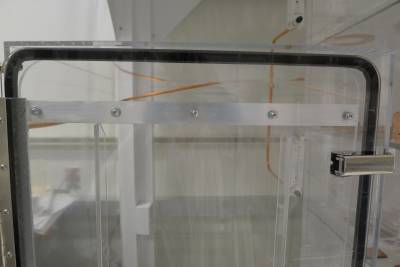
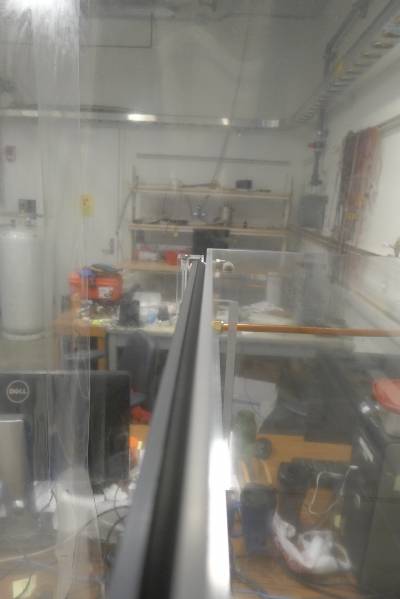
To remedy the bowing of the door to the large purge cabinet, Nick M and Dan C attached horizontal aluminum braces to the door, one toward the top and one toward the bottom. The figure below shows the braces and that the seal is now quite flat and looks like it should work as intended:
| Figure 1e: Fix for the bowed door of the large purge cabinet | ||
|---|---|---|
 |  |  |
When the door was being fixed, the nitrogen to the large purge cabinet was turned off. This allowed for improved flow to the small purge cabinets. The second small purge measurement was done with a flow rate of about 2 std ft^3/hr, and showed the much improved radon concentration shown in the table at the top of this note.
Trends over time
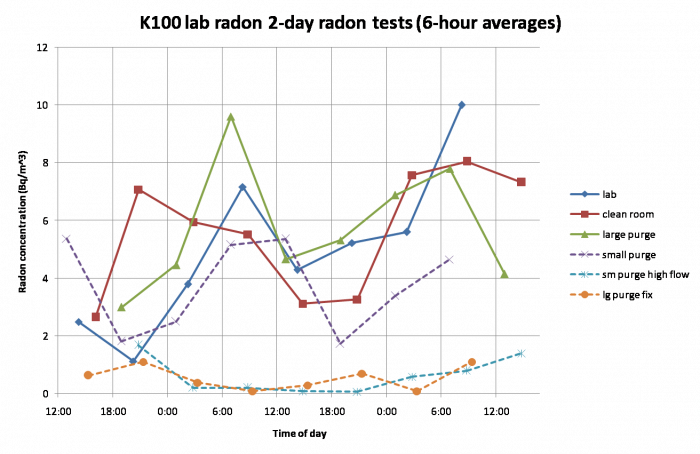
The plot below shows the measurements averaged over 6 hour periods for all 2-day runs, plotted together to show changes over time of day:
| Figure 2a |
|---|
 |
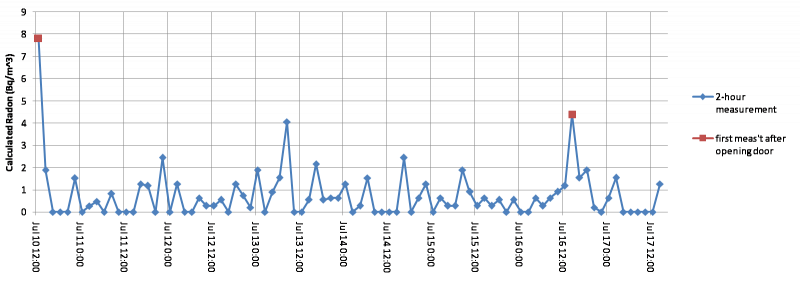
The figure below shows the results of a longer test (one week, measurements every two hours) in the large purge cabinet after it was fixed. Toward the end of the test we tried opening the door for 30 seconds and closing it to see the effect (red dot). Just before the run began we also had the door open to insert the desiccant tube. So there are two examples of how high the radon level gets when the door is open (around the same level as the room, not surprisingly) and how long it takes to purge again after it's closed (4-6 hours roughly).
The mean for this run was calculated with the red data points and the two data points after them removed, resulting in 0.6 ± 0.2 Bq/m3. Assuming the RAD7 unit is accurate at this level it appears that there is still a non-zero residual radon level. There is no detectable pattern between radon rate and time of day so this may suggest a residual radon content in the nitrogen supply rather than a leak from the outside air.
| Figure 2b |
|---|
 |
Since the first three tests are roughly consistent with one another, the plot below shows results from all three runs averaged by time of day, with a sinusoidal fit:
| Figure 2c |
|---|
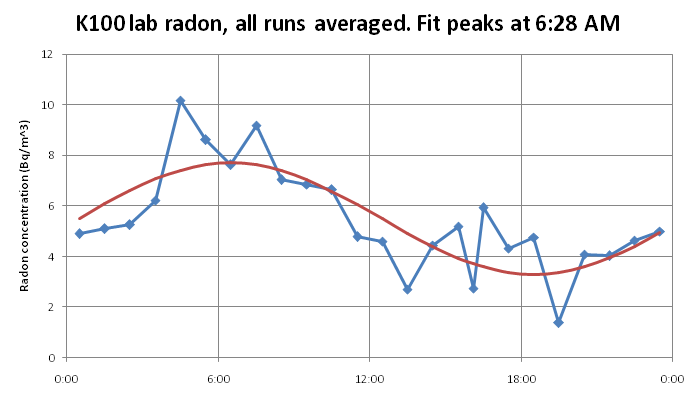 |
The radon seems to peak early in the morning, which is around the coldest time of day. But perhaps more significant is that it rises overnight when no one is in the lab, and falls when there's activity. It could be that opening and closing the door lets in more fresh air and lets out radon that accumulates overnight. It's also possible that the building air conditioning/circulation runs in a different mode overnight.
The clean room and purge cabinet runs were done entirely over weekdays, but the lab run began on a Friday. Note in Figure 2a that for the lab run the radon rises more near the end of the run. It seems to go down on Saturday (when people were in the lab briefly to perform a LHe transfer) then increases into Sunday higher than the weekday runs.
In the first small purge cabinet measurement the amount of radon was reduced but it seems to show the same 24-hour modulation as the other runs. This suggests some contamination from the outside air. In the second measurement with increased flow the radon is very small though there may still be a hint of the modulation.
Particulates
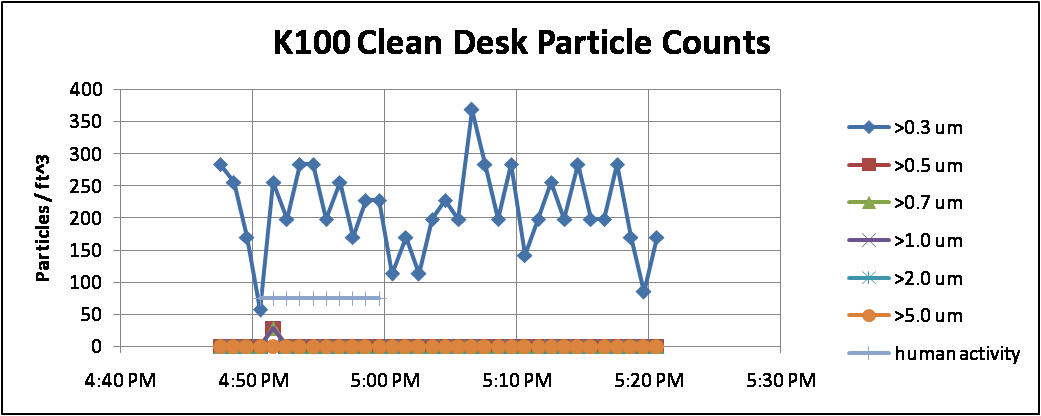
We used a ParticleScan CR unit borrowed from Soudan to assess the quality of our cleanroom. Several tests were performed in the main cleanroom area on the work desk and also on the clean bench with laminar flow hood. The unit was set to take a reading every minute and ran in the “at-rest” state (no one in the clean room) and in the “operational” state (with human activity in the vicinity of the unit, similar to normal work performed in the clean room).
The unit takes data for several particle size categories: 0.3 μm and larger, 0.5 μm and larger, 0.7 μm and larger, etc. The unit has a cleaning mode: a HEPA filter accessory is attached to the inlet and the unit is set to normal counting mode, and should reach 0 counts in all categories in less than an hour. We found that after a day in this state the 0.3 μm still hadn't reached zero, but rather stayed at a background level of 150-200 particles/ft^3. The other categories all read zero. For this reason the 0.3 μm data below should be considered internal background.
The class of a cleanroom (Federal Standard 209E) is the upper limit on the number of particles 0.5 μm and larger per cubic foot, rounded up to the nearest power of 10. At-rest and operational classes can be separately defined. The operational class is the more important one since almost all contamination of hardware will occur during human activity.
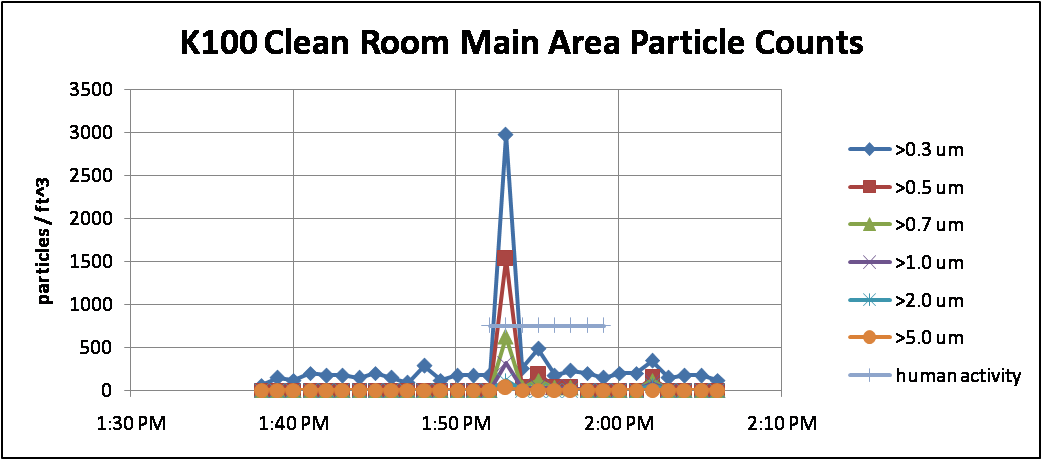
The plots below show results in the clean room and the clean bench, with periods of human activity marked. These represent the worst cases of the several tests performed.
| Figure 3a |
|---|
 |
| Figure 3b |
|---|
 |
For the clean room main area the maximum count seen in the 0.5 μm category was 1529/ft^3. Thus we can claim that in the operational state it is class 10,000 (though it's nearly one class better than this, class 1000).
For the clean bench the maximum count seen in the 0.5 μm category was 28/ft^3. Thus we can claim that in the operational state it is class 100.