1.4 MeV Peak
Am-241. Data series 07110602_0911 through 07110602_2330 used for analysis. -2.5 V DIB1; +2.5 V DIB2; charge and phonons, trigger on 8 phonon channels at 18ADC bins. Trace length 3.2768ms (8192 samples), lookback time 400us; ozip format. 30min data, 6s flashing, 15min cooldown.
| Figure 1: Qsum Spectra. |
|---|
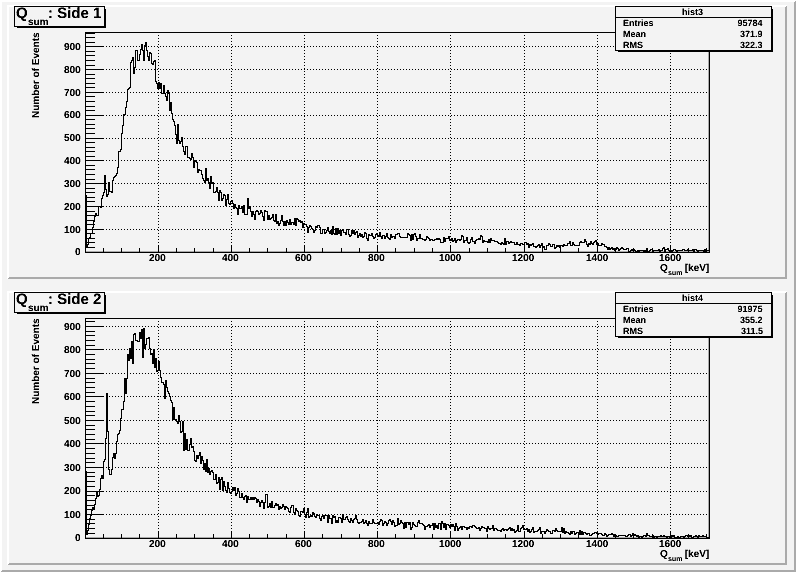 |
Notice that although the sources are on side 2 (as shown by the side 2 60 keV peak), the 1.4 MeV peak is clear only on side 1.
| Figure 2: Qsum Spectra. |
|---|
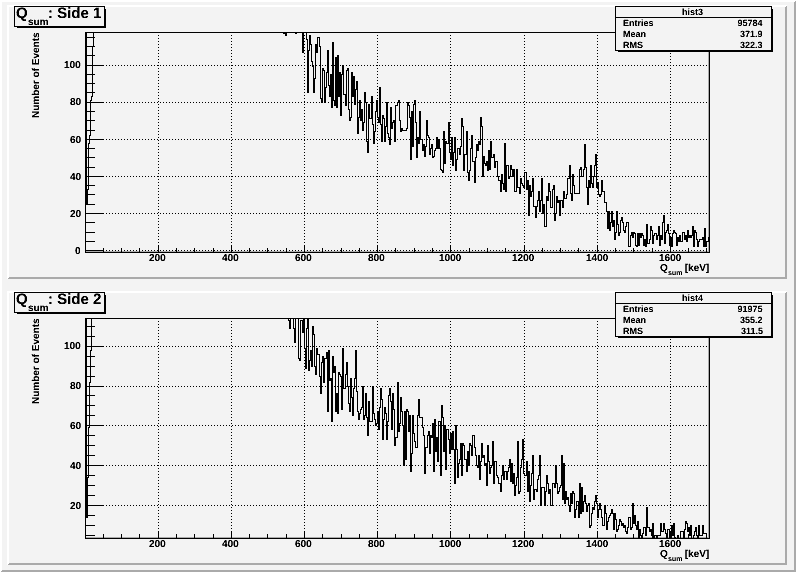 |
A closer look at the 1.4 MeV peak suggests that it is not just noise.
| Figure 3: Max Qsum vs. Ptot. |
|---|
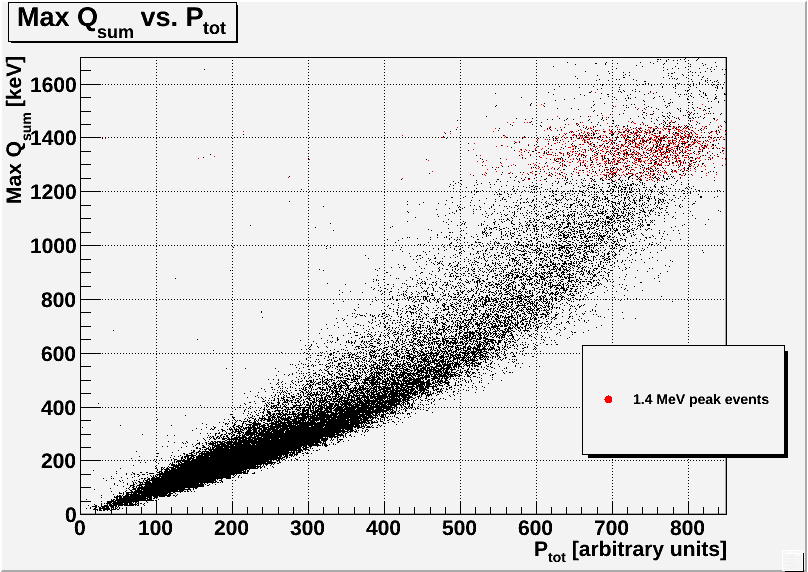 |
When looking at such high energies, the relation between Qsum and Ptot is not linear.
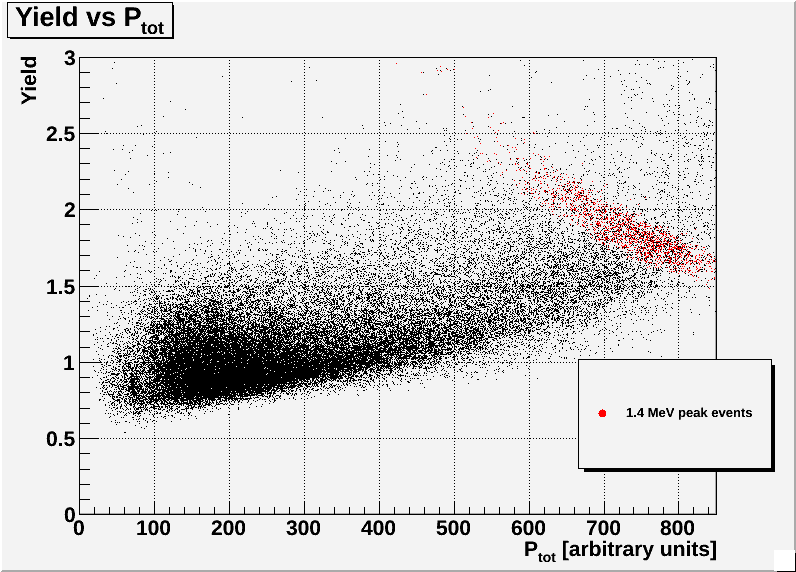
| Figure 4: Yield vs. Ptot. |
|---|
 |