Box Plots
Data series 07110525_1928 through 07110525_0723 used for analysis.
| Figure 1: Qsum Spectra. |
|---|
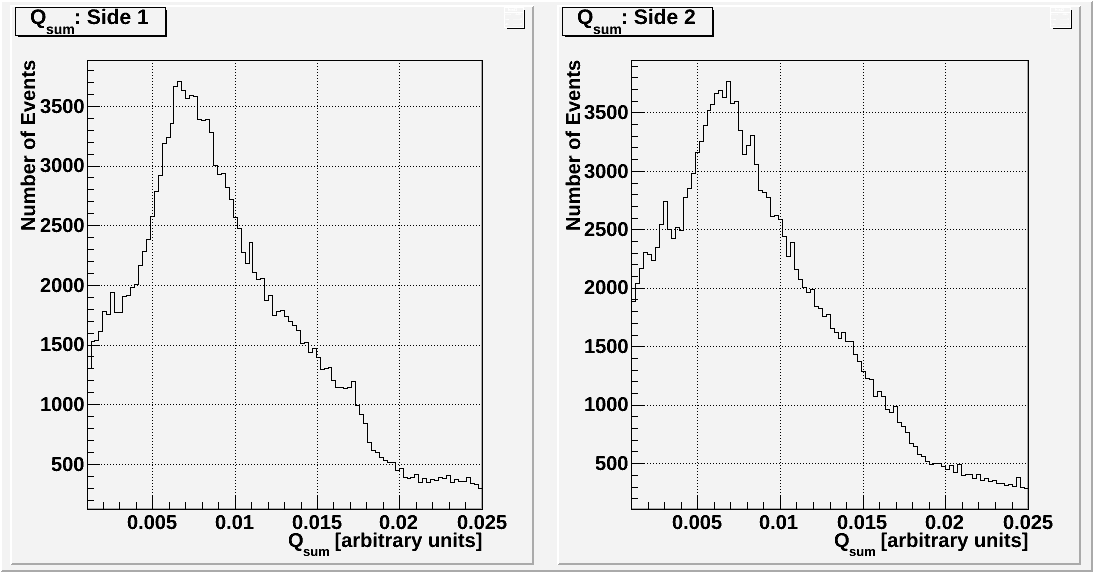 |
Notice the 60 keV peak on side 2.
| Figure 2: Phonon Response. |
|---|
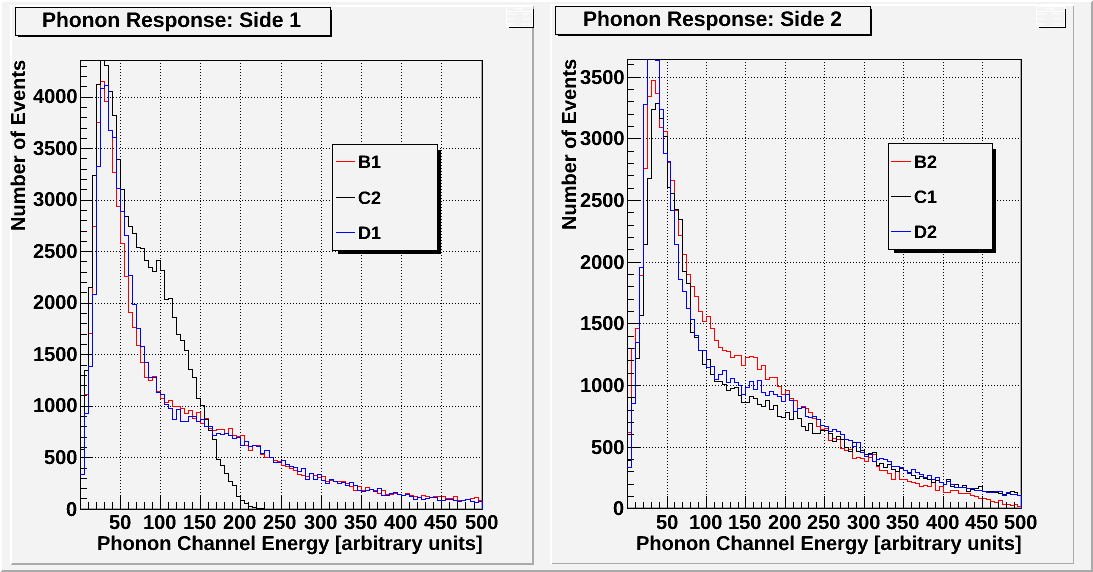 |
Outer phonon channels A1 and A2 are not included.
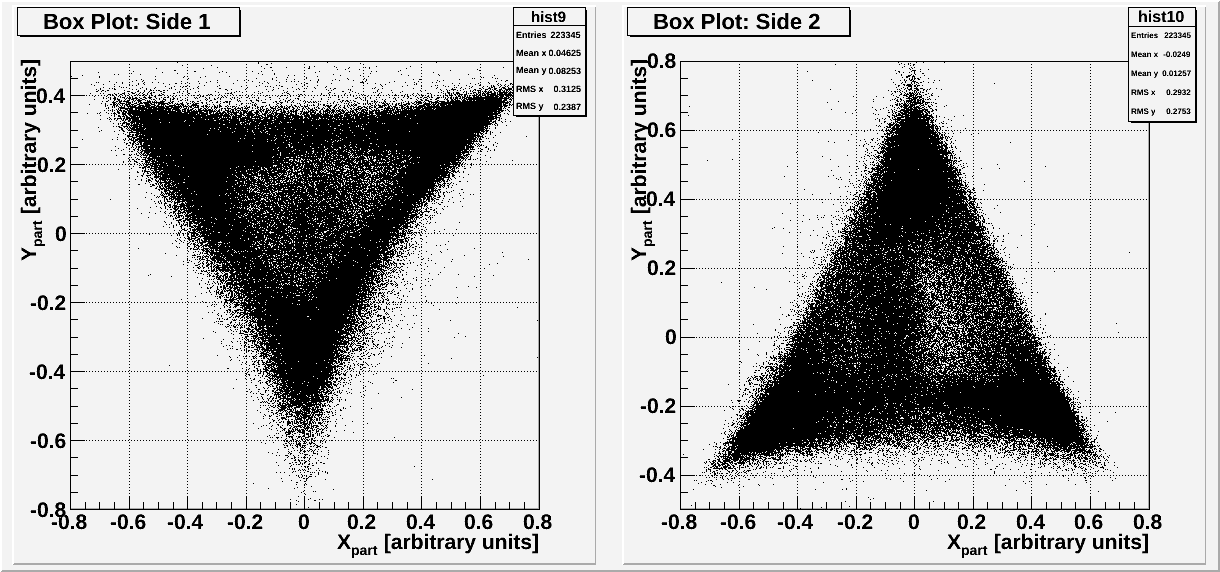
| Figure 3: Box Plot. |
|---|
 |
| Figure 4: Box Plot when Qsum is near 60 keV peak. |
|---|
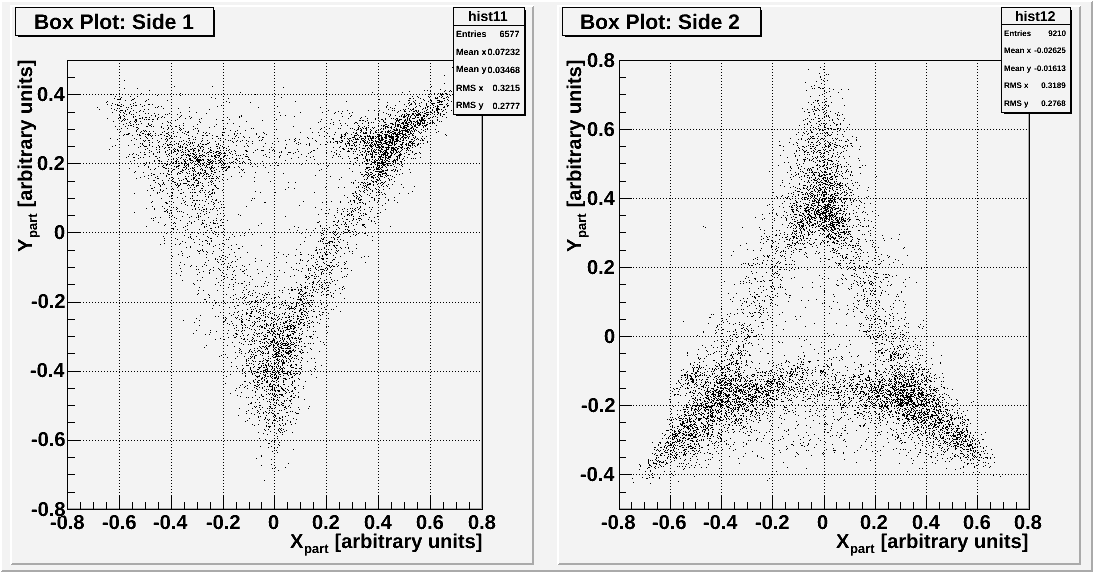 |
Figure 4 shows the box plot of all points such that the Qsum of that side is near the 60 keV peak (0.0027<Qsum<0.0034).
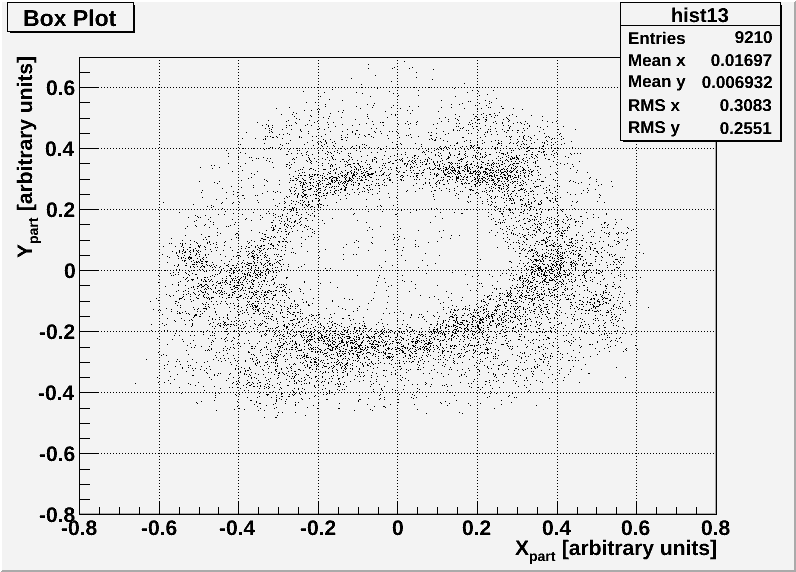
| Figure 5: Box plot when Side 2 Qsum is near 60 keV peak. |
|---|
 |
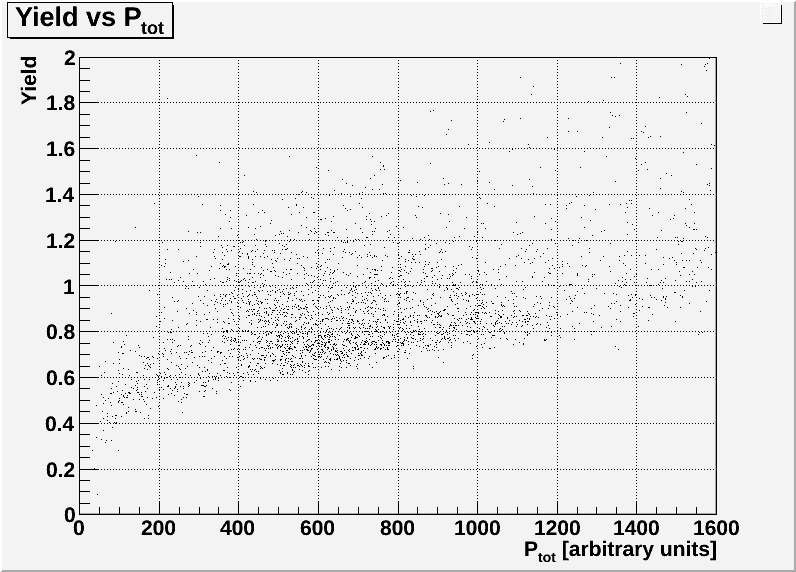
| Figure 5: Yield for first 30 minutes. |
|---|
 |
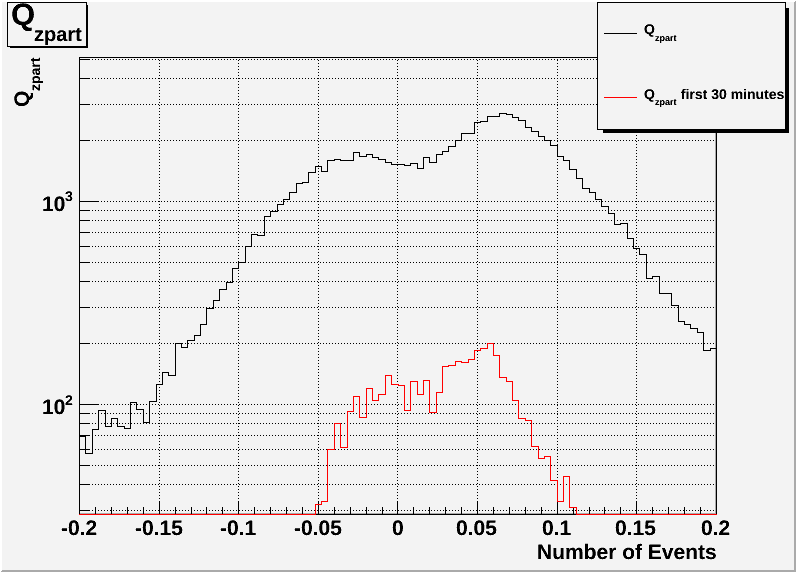
| Figure 6: Qzpart. |
|---|
 |
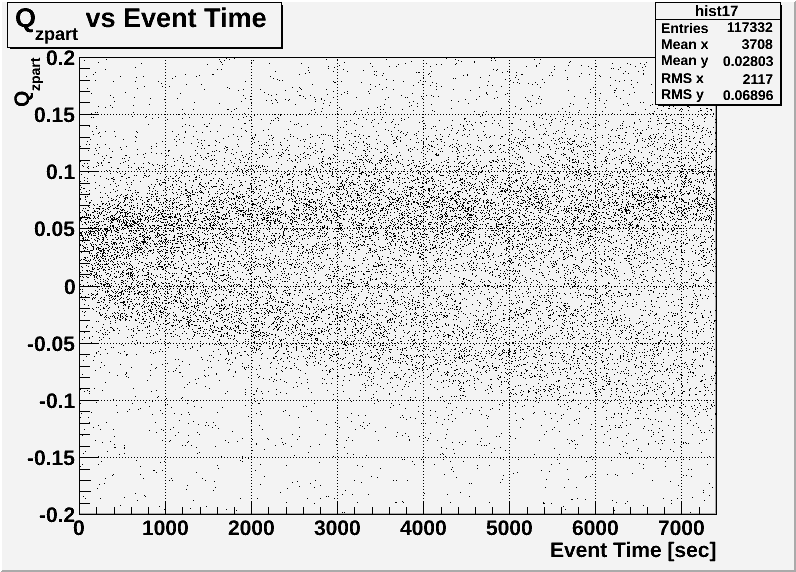
| Figure 7: Qzpart vs. Event Time. |
|---|
 |